A new map on CDRC Maps showing perhaps one of the simplest demographic metrics – residential population density – how many people live in each hectare across the UK. The data is available at the smallest statistical area available (output areas in GB and small areas in NI) and I have combined this with the various urban/rural classifications used by the three national statistical agencies across the UK, to produce a single map. Colour is the urban/rural classification, and lightness/darkness shows how densely populated each area is. Because urban areas are so much more densely populated than rural ones are, I’ve used a series of scales to gradate the representation of density on the map – the scale used depends on the classification. This is the best way to allow both high and low density populated areas to be able to show local variations.
A few observations:
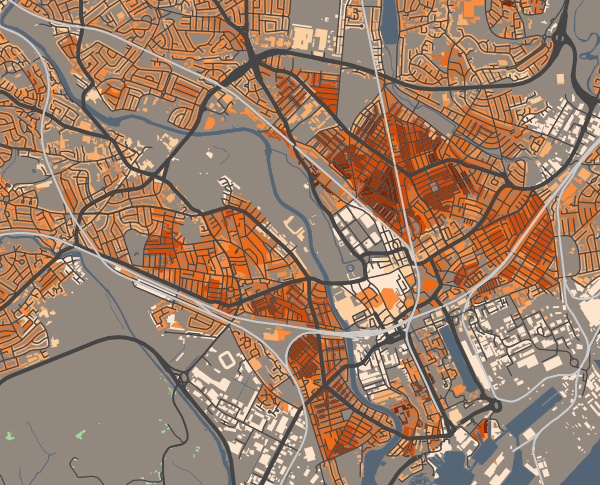
- many linear blocks along roads in east London have a noteably high density compared to the rest of suburbia – there are not tower blocks here, just terraces, so maybe this is a sign of overcrowding?
- The centre of Birmingham is extremely low density – very few residential blocks here.
- There is a significant contrast between high-density Portsmouth, hemmed in on three sides by water, and the much lower density Southampton, not far away, which is not so constrained by the sea.
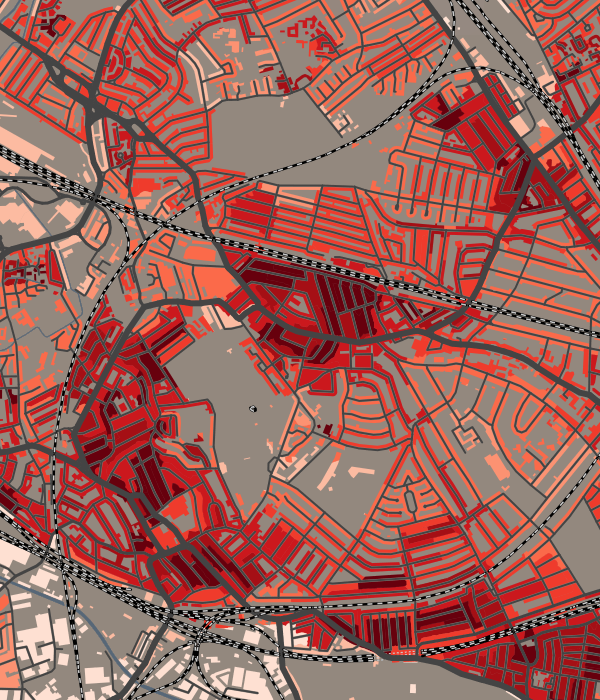
- Many cities, such as Cardiff (above) show a distinct pattern where the inner city has two parallel zones of high-density population, either side of a relatively sparse CBD core. Other cities where this is seen include Plymouth, Glasgow and Leicester.
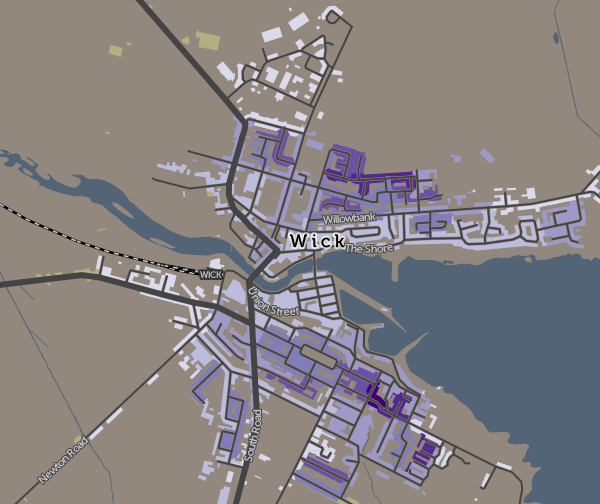
There are flaws in this method of combining datasets across national boundaries. The different agencies calculate in different ways. Notably, in Scotland, the small areas are themselves smaller in population and are designed to better encapsulate the urban part only of settlements, with different small areas for the rural parts. As such, Scottish villages tend to show up as higher density than their English counterparts, which by necessity often need to include a substantial rural element in order to hit their population threshold. This is a statistical quirk.
The other significant difference is that English/Wales define “sparseness”, while Scotland and Northern Ireland use “remoteness” and measure this quantitatively in terms of driving time to the nearest settlement of over 10000 people. The definition of sparseness does not relate to distance from such settlements and therefore there are some “urban” areas with population of over 10000 but in a sparse setting. For consistency, I consider these alongside remote settlements in the other nations, which are considered rural. The raw data download, on CDRC Data, includes a simple urban/rural flag if you prefer to use the strict urban/rural definitions.
As ever, please note that maps on CDRC Maps show all buildings but the data is generally for residential buildings only. The data is a single value across the whole small area, not a measurement of population in individual buildings.