Categories
Data Graphics London Mashups

CityDashboard makes it to the Mayor of London’s Office and the BBC!

bbcipad1

bbcpiad2

CASA colleague Steven James Gray used the API from CityDashboard, which I created early last year by aggregating various free London-centric data feeds into a single webpage, to power the data for a 4×3 array of iPads, mounted in a wooden panel, itself iPad-esque in shape. The “iPad wall” was mounted in the Mayor of London’s private office high up in City Hall, so that the mayor, Boris Johnson, can look over the capital digitally as well as physically. The idea of having the digital view directly adjacent to the physical view was also captured in the fleeting but beautiful Prism exhibition by Keiichi Matsuda at the V&A, another use of the CityDashboard API.

Today the BBC has picked up on the iPad wall and featured it as London’s example of emerging smart city technology. Scrolling down the article reveals it in all its glory. It’s somewhat flattering for the iPad wall and CityDashboard to be included this way, seeing as it’s just a number of HTML scrapes regularly running from various webpages, bundled together with pretty colours. The concept only works because of the many London-centric organisations that make their data available for reuse like this, not least Transport for London. It’s not going to change the way London operates like grander Smart City ideas might, but crucially it’s already out there. The BBC emphasises that it’s cheaper than Rio’s (well, yes, because the physical bit was built in CASA on a cost-of-materials basis, as part of a UCL Enterprise grant) and that it’s available to all, not just the Mayor. Almost true – CityDashboard doesn’t quite look like the physical iPad wall, but I’m minded to tweak the design and produce a version that does.

Anyway nice to know, via the BBC, that the wall is running and the data is ticking. The Mayor of London’s team can change the content on a number of the panels to show their own custom statistics. I was pleased to see, looking carefully at the photo in the article, that my Bike Sharing Map also makes an appearance.

Categories
Orienteering

Urban Race Season

It’s late summer, the Scottish 6 Days are over, it’s time for Urban Race Season in the UK! As people return from holiday, and with the forests remain overgrown, late August and September are the peak time for races taking place in the cites rather than the countryside.

Four weekends of interest for those in more southerly parts of the UK:

Harwell Sprint Race – Bank Holiday Monday 26 August

A sprint race around the nuclear technology and particle accelerators of the Harwell scientific research campus! Watch out for your compass, magnetic field line distortions may occur during the race. Details.

Lincoln & Sheffield Double Header – 31 August/1 September

Both Lincoln and Sheffield have put on solid and varied urban races in previous years – with Lincoln’s historic centre, “Steep Hill” (a street name) and lower commerical area and university campus, combining well with Sheffield’s varied urban nature. Details (Lincoln). Details (Sheffield).

Bristol City Race Weekend – 7/8 September

The BOK Blast – urban orienteering comes to Bristol, with university campus sprints on the Saturday at UWE, and a full-on city race on the Sunday. Details.

London City Race Weekend – 21/22 September

Already the biggest standalone urban orienteering race in Britain, the Sixth London City Race combines with an Ultrasprint in Victoria Park the day before. This year’s City Race takes place in Canary Wharf and the Isle of Dogs. Senior courses racers will take the Docklands Light Railway to the start line and then race the length of the island, through docks and around skyscrapers, to the finish line overlooking Royal Greenwich. It will be the best race yet! This might be your only chance to orienteer this fascinating area. Details.

Categories
Orienteering Orienteering Events Log

Scottish 6 Days Part 2: Day 6 & Trail-O

The final day of Moray 2013 looked, on paper, quite similar to the others – around 9km, like the previous 5 days. However it was quite different in feel, with the combination of climb (495m) and both technical and physical sections of the course, meaning most people, including me, took ~20% longer than on their other days.

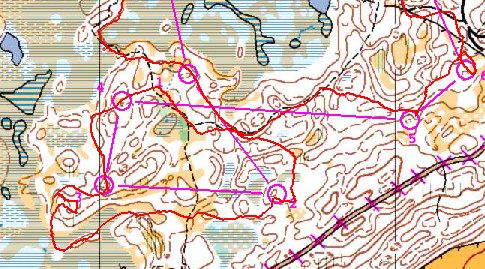
The first part of the course was a control pick, with many short legs, in technical and hilly wooded moraine terrain. The forest looked very pleasant in the sunlight, and the controls came up fast:

s6d6part1

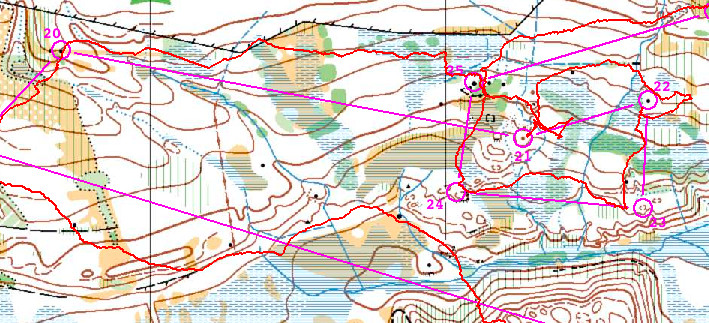
The second part, however was physically tougher. After crossing the A939 road, the undergrowth levels increased, and a couple of long legs proved to be a good test of navigation. A vaguely mapped, low-visibility and marshy area near the end was a nasty suprise, with four controls for M21L proving to be hard to find:

s6d6part2

(The elites ran through this area without any controls in it, although to be fair they did have a 17.1km course.)

For the last few legs of my 9.3km one, I ran out of energy, for the first time in the week, and ended up walking up the last hill. I expected a bad result, but it turns out everyone else found it tough too, and I finished in the top third today and overall.

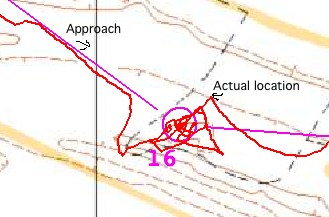
A few days before, during the “rest day”, I tried out the Trail-O course in Culbin. My only previous Trail-O was in Portugal, where I didn’t do particularly well, partly because I overthought the planning. Trail-O is perhaps the most pedantic form of orienteering, which much though and toing-and-froing needed to work out exactly which of the controls on the terrain are the mapped ones. In the toughest control sets, there were typically only one metre between controls, and Trail-O participants don’t even get to visit the controls themselves, being restricted to the path network. Still, it was a good challenge, and I again finished in a lower position than I was hoping, with 17 of the 23 controls correct – the winner got 21, so maybe if I’d spent a little longer, or conversely a little less time to overthink it… One of my 6 mistakes was due to not understanding the difference between the viewing and punching point, resulting interestingly in a parallax error. Fellow SLOWie Michael Balling unexpectedly won the entire Trail-O competition, beating the British Team, even though he jogged rather than walked around the course, getting around in the fastest time even though there is no bonus for that. There is a lesson there!

Over an enjoyable Scottish 6 Days, on six great areas, and I look forward to 2015’s event which will be not far away, and combined with the World Championships.

Categories
Orienteering Orienteering Events Log

The Scottish 6 Days at Moray

I’m just back from six days of top quality orienteering races in Moray, north-east Scotland. As ever, the days were very varied, with three days of forested dunes, two hilly inland map, and one flat (but still intricate) forest that I once trained in when in the Army section of the CCF at school! The Scottish weather also lived up to its four-seasons-in-a-day reputation, with two days of pouring rain, two days of bright sunshine, and everything in between. I was running M21L, as I didn’t think I would make it around the M21E 17km+ classic on Day 6, and because I was aiming for the top half of the results table each day, rather than inevitably hanging around the bottom 20% as would happen on the Elite class.

Day 1 was at Lossie forest, a classic sand-dune area which I didn’t have great memories of – mainly because I was smaller when I last ran it and I remember the sand dunes being steep and dense – walking rather than running required in order to avoid getting quickly lost. Sadly, it is not quite the same as it was these days – a new track running right through the intricate part meant that the technical level has greatly dropped, and the course design (perhaps necessitated by the sheer number of people, around 3500, at the Scottish 6 Days event) meant that many of the legs were a procession between controls, with people and/or tracked routes pointing the way between controls.

I had a very poor start, heading off 90 degrees in the wrong direction (following the train…) and later on I made my biggest mistake on this day, although this was primarily due to a control being placed on a feature mapped in the wrong location on the map. Discussion afterwards indicated that plenty of others also were delayed here, but unfortunately I responded particularly poorly to the map’s mistake, looking for an (absent) flag rather than the misplaced feature, which was fairly easy to see, if 80 metres NE of where it should have been:

s6d1mistake

Day 2 was the aformentioned Army area – Carse of Arsidier. I had a cleaner run here, with just the few small mistakes which were a hallmark throughout the week of me not staying in enough contact with the map as I should be. Day 3 was back onto dunes, at Culbin, although it was the western part of the map rather than the more familiar main section which we visited during the following rest day for a Trail-O. Day 3’s result was my worst of the week, although I think this was primarily due to having an early run on that day, with little tracking to follow. There is a presumed correlation between the time people run on a large forested (i.e. trackable) event and how well they do. Day 4 was the first hilly day, at Loch of Boath. Unfortunately it was also the wettest day. It was also potentially my best day, with a pretty clean run, until near the end when I started to think “I’m on for a good one here” and promptly made two medium-sized mistakes in a row.

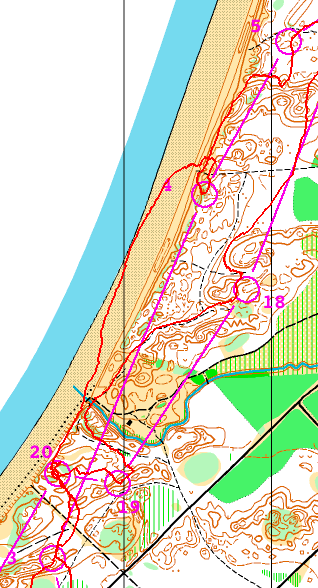
Day 5 was back to the dune areas and Roseisle. This was always going to be my favourite area of the week and so it proved, with undergrowth-free pine forest (with a lovely natural pine smell in places!) providing just enough technicality to slow down the sprinters. I took three legs on the beach, just because I could, rather than because it was the best route – the problem here though was that it was difficult to spot when to go back into the forest. I overran the first beach leg (3-4) and underran the second (4-5):

s6d5beach

More to follow in the next post on Day 6 and the Trail-O.

Categories
Data Graphics

Map of the Complexity Sciences

complexitymap

Above is a small extract of an interesting roadmap (also printable PDF version) from the Art & Science Factory, produced by Dr Brian Castellani. It was first posted back in early 2009, this is the fifth edition published earlier this month. It shows connections between the different strands of the Complexity Sciences and how they are linked to related disciplines. UCL CASA’s Prof Michael Batty makes an appearance – in the future section (2015) on the far right hand side, linking to his Cities and Complexity work – the Science of Cities.

The chart goes right back to Isaac Newton (the 1940s-1950s caption here perhaps not quite right!) and also references John Conway’s seminal Game of Life, as a feed into Cellular Automata models.

Castellani, Brian 2013. Complexity Map Version 5. Sociology and Complexity Science Blog. http://sacswebsite.blogspot.com/2013/07/the-complexity-map-version-5.html.

Categories
Leisure

North Downs Way Relay

I ran in the annual North Downs Way Relay for the third time, last Saturday, covering the leg from Charing to Hollingbourne. This year’s race was in very hot weather and the team suffered injuries, hospitalisations and several people getting lost – however somehow we still managed to get the win – albeit in one of the slowest times ever. The race is a relay running along the length of the North Downs Way from Dover to Farnham. Sometimes, including this year, the race is split into two halves, with two simultaneous mini-relays running from the ends to a central finish at the Vigo Inn.

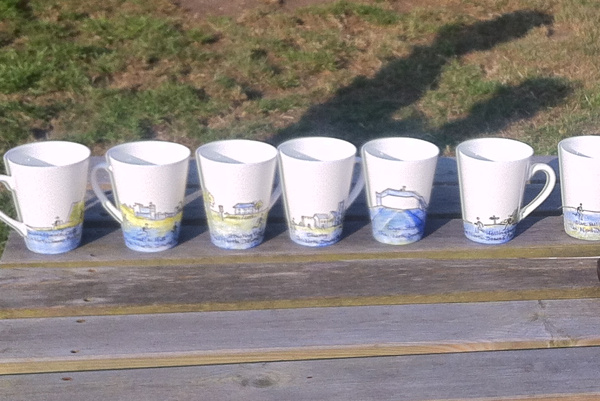
This year’s leg winners were each presented with a hand-painted mug showing their leg on it, as well as some of the sights on the way. Having won my leg (one of the shorter and easier ones at 13km with not too much climbing) I was pleased to be awarded my mug at the prizegiving, which was in the pub garden of the inn.

Here’s my leg:
ndwroute

Categories
Data Graphics

Snowden Route Maps

Compendium of not-great maps produced by the media showing the alleged route that data leaker Edward Snowden may or may not have taken around the world. Thanks to Spatial Analysis for tipping me off with the Guardian’s effort and seeding the idea for this blog post.

Sky:
230613-snowden-route-map-v2-final-1-522x293

Apparently the route from Hawaii to Hong Kong goes via Brazil and Madagascar. The map’s filename includes “v2-final” indicating this is not a first draft. The labels variously show the city, the state, the country, or sometimes a combination.

BBC:
Screen Shot 2013-06-24 at 17.21.48

Better, although uses fake (but incorrect) Great Circle curves.

The Guardian:
Screen Shot 2013-06-24 at 15.04.27

Google Maps?!

Business Insider:
snowden-on-the-run-nsa-leaker-flies-to-russia-heading-to-cuba-and-then-to-ecuador-or-venezuela-reports

Google Maps!

Daily Mail:
article-0-1A78F3E2000005DC-774_634x480

The long way around to Hong Kong. Includes nice shadow effect showing that the curve is simply due to the height of the plane above the ground – the further you go the higher you fly!

Here’s how to do it – use Great Circle Mapper:
map_5segs

Great Circle Mapper is Copyright © 1996-2013 Karl L. Swartz. All rights reserved.

(N.B. Some long-distance air routes use jetstreams rather than Great Circle approximations, as this is more efficient in terms of fuel/speed, even if the journey is further.)

Categories
London

The Micrarium at the Grant Museum

mic1

I was at the Grant Museum of Zoology, one of UCL’s public museums in Bloomsbury, last week, helping install a new set of iPads for some interactive exhibits in there. The museum a small but fascinating space, it has been around since the 1820s but recently moved into a, larger space, although it still has a lovely old-fashioned feel to it, with display cabinets and drawers full of unusual stuffed or pickled animals, such as the Jar of Moles.

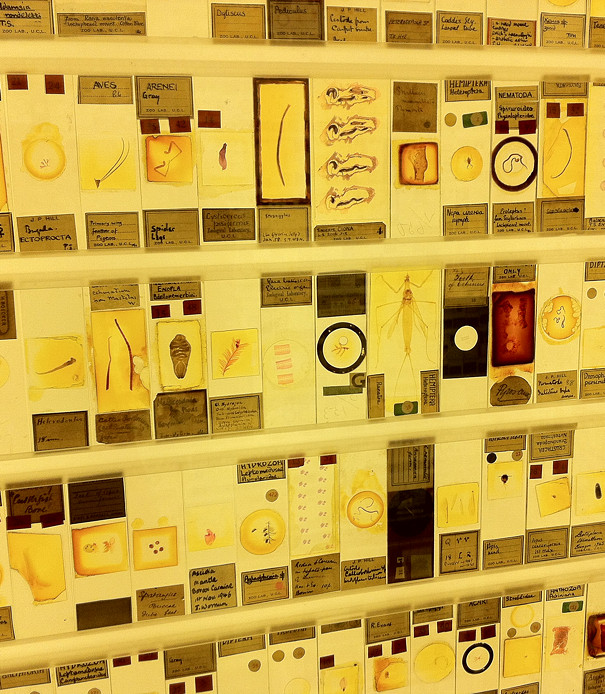
Anyway, I was delighted to finally visit the Micrarium, a new exhibit dedicated to the very small, it consists of three walls crammed full of slides of tiny things, displayed around a booth that you can walk into, with a mirror on the ceiling to complete the effect. While looking at the tiny specimens is an interesting exercise in itself, I was particularly taken with the design. Unlike the rest of the museum, which is mainly made of varnished wood cases and dimly lit for preservation reasons, the Micrarium is strikingly lit and immediately invites closer investigation – you have to get up close and personal with these tiny specimens in order to simply see what they are.

The idea of having a “all around you” booth in a museum reminds me of the “interactive Booth map” at the Museum of London, which I visited shortly after it opened a couple of years back.

The museum and Micrarium are free to visit and are open on weekdays from 1-5pm, located at the junction of Gower Street and University Street (I do love that there is a street with that name in London). If you do manage to visit, take a moment to answer one of the philosophical questions on the iPads, or tweet #GrantQR.

mic2

Cross-posted from my leisure blog.

Categories
Leisure

The Micrarium at the Grant Museum

mic1

I was at the Grant Museum of Zoology, one of UCL’s public museums in Bloomsbury, last week, helping install a new set of iPads for some interactive exhibits in there. The museum a small but fascinating space, it has been around since the 1820s but recently moved into a, larger space, although it still has a lovely old-fashioned feel to it, with display cabinets and drawers full of unusual stuffed or pickled animals, such as the Jar of Moles.

Anyway, I was delighted to finally visit the Micrarium, a new exhibit dedicated to the very small, it consists of three walls crammed full of slides of tiny things, displayed around a booth that you can walk into, with a mirror on the ceiling to complete the effect. While looking at the tiny specimens is an interesting exercise in itself, I was particularly taken with the design. Unlike the rest of the museum, which is mainly made of varnished wood cases and dimly lit for preservation reasons, the Micrarium is strikingly lit and immediately invites closer investigation – you have to get up close and personal with these tiny specimens in order to simply see what they are.

The idea of having a “all around you” booth in a museum reminds me of the “interactive Booth map” at the Museum of London, which I visited shortly after it opened a couple of years back.

The museum and Micrarium are free to visit and are open on weekdays from 1-5pm, located at the junction of Gower Street and University Street (I do love that there is a street with that name in London). If you do manage to visit, take a moment to answer one of the philosophical questions on the iPads, or tweet #GrantQR.

mic2

Categories
Bike Share Conferences

Bikeshare 100

vcpres_front

This is the presentation I gave at the Velo-City 2013 conference last week – I’m uploading it here as quite a few people have asked for it. The PDF contains my whole talk, except for some graphics from a couple of forthcoming papers which haven’t been published yet, and a conceptual image from a paper that we haven’t even started doing the research for yet!

The paper includes an introduction to EUNOIA, which is my main research project. Bikesharing data will form a small but useful part of this two-year EU transport mobility modelling project.

Here is the PDF of the presentation.

At time of presenting last week I was monitoring 85 cities live, since then I’ve added quite a few more (and dropped a couple) so I am now at 98 cities!

The new cities are:

Castellon and Leon were particular headaches, as they don’t have an official live map with location data – so I had to use a combination of third-party location data and manual georeferencing the newer locations! Oxford is also the first system where there are not a fixed number of docks. Implementing this on my map was a bit of a kludge. I’ve assumed that there are always more docks than bikes there, with a minimum 10 docks at each docking station.

Fixed cities are:

I’ve also switched the Mexico City feed to using the citybik.es service.

Dropped cities include Pavia (too small) and Stockholm East (too small). Nantong and Guadalajara have also been put on hold as their feeds have frozen for the last few days.

Cities I’m hoping to add very shortly are:

  • Portugal: Torres Vedras (launches 22 June)
  • France: Clermont-Ferrand (launches 27 June)
  • USA: Chicago (launches 28 June)

So Chicago’s DivvyBikes could well be the 100th system I’m tracking – and my presentation title will be valid!

You can see all the cities I’m tracking on the global view of my Bike Sharing Map – I also took the opportunity at the conference to launch this new, consolidated view.