Categories
Data Graphics Geodemographics OpenStreetMap

Main Street UK

GEMMA is the project I’ve been working on for the last six months, it’s one of the JISCgeo projects and it is now released – although consider it to be beta as there are lots of bugs and UI quirks that we are aware of. More about GEMMA can be found on the project’s blog.

One use of the OpenStreetMap feature highlighter in GEMMA, that was suggested by one of the participants at the JISCgeo Meeting earlier this week where we launched the web application, and augmented by a friend who was trying it out, was mapping the occurrences of the “High Street” road name – and a few regional variations, namely Main Street, Front Street, Market Street, Fore Street and The Street. Using GEMMA, and the high level of completion of OpenStreetMap in the UK and Ireland, allows us to visually show the spatial patterns of such street names.

Here’s a stitched-together screenshot of the GEMMA webpage showing the pattern throughout the UK and part of Ireland:

It turns out that Main Street is popular in the Midlands and in Scotland and Ireland, and Front Street is popular in the North-East of England (around Newcastle) while High Street is used nearly everywhere in the UK – but only sparingly in Ireland. Market Street is popular in the Manchester and Devon areas. Fore Street is popular in Cornwall and The Street very popular in Essex and Kent.

Note that many parts of Northern Ireland and the Republic of Ireland, are not yet well mapped in OpenStreetMap, so the street names will be missing in some parts here. The base-map is copyright Google and the street data is CC-By-SA OpenStreetMap.

You can see the live version of the map here.

Categories
Data Graphics

The Relative Urban Footprint of Tokyo and London

I was intrigued by this tweet that appeared in my Twitter client this morning:

It’s one of those tweets that makes you go “That doesn’t sound right?”

Is Tokyo really a third of the size of England? It generally takes just under four hours by highish-speed train from London to the edge of England (Berwick) and a similar amount of time to get down to Cornwall. Even Wales is a good couple of hours away. I know they have ultra-fast trains in Japan but can Tokyo really be that big?

The link offers up the following map as proof, which appears to be based on Google Earth (very likely Copyright Google and its aerial imagery partners):

Some of the comments on the source article mention the key point that the Toyko metropolitan area, an administrative area, contains a large amount of rural land. The same is somewhat true of London – parts of the south-eastern fringe of the Greater London Authority (GLA) area are very definitely rural, and conversely built-up areas (Loughton) are outside of the GLA but part of the London continuous urban area and very much feel part of London – e.g. it’s on the tube network and in Zone 6.

Another example of administrative areas not coinciding with urban areas is that the City of Edinburgh council area extends well away from the city – but only to the west (i.e. to the Forth Bridge). In all other directions, the boundary is not far from the city bypass which is itself not far from the urban area, or there’s water in the way.

So a better comparison would be to visually compare the built-up areas of the two cities, first of all making sure that the scales are exactly the same and that the projections are appropriate for each city – I’m not saying this is not the case for the Google Earth example, although you do have to be careful with how Google Earth displays scales for, and projects, very large areas, as they are not always 100% rigorous.

I asked James of Spatial Analysis to have a quick look, as he had the data to hand, and he’s produced the rather lovely map which is at the top of this article. Thanks James! The dark grey areas are built-up areas and railways and the land and sea are also shown for context. A rough visual comparison of the map shows the urban area of Tokyo is maybe 3 times the size of London. This kind of equates to the population difference (8.5 million vs 31 million, using very rough numbers) and shows that Tokyo would fit quite snugly into Kent, rather than taking up much of southern England as the original statement implied – its own map, while exaggerating the urban area, also doesn’t quite cover a third of the nation.

(As an aside – it’s tricky to define exactly what a metropolitan area is – Wikipedia’s article for instance has very different numbers.)

So Tokyo is big – yes – but not nation-eating gigantic. I could probably just about cope with it.

Categories
Data Graphics

Human Visualisation

One thing I noticed in Vienna, and passing through Brussels airport on the way home, was a number of “augmented reality” advertising displays, ones that detect people in front of them and then show that on their screens. In all the following, Steve Gray of CASA was the subject being visualised.

Here was the first I saw, at Wien Mitte S-Bahn station, where a special “performance” box was taped out on the platform alongside:

Then, at Vienna Aiport, they had a screen above part of a walkway, which augmented various “forest” animals with passersby. Rabbits and deer would appear, grazing on the “grass” when no one was passing. As people approached, the animals would disappear back into the undergrowth. Passing people on the screen left virtual “leaf trails”, while butterflies would occassionally land on their shoulders. Unfortunately my camera didn’t take a great picture, although you can see a butterfly on someone’s hair and some leaf trails here:

On changing through Brussels, a “heat scanner” showed passing people. This was beside a travelator, so your moment of fame was brief:

Vienna itself currently has a aural art installation from the Royal College of Arts. On walking through the Meccano-like sculpture, detectors would sense you and a nearby speaker would start playing a musical sound. Each detector had a different sound type, but they worked in harmony to produce a kind of song, changing as you and other people moved around:

Sadly, on our arrival into Heathrow, we were back to the regular non-augmented ad experience.

Categories
Data Graphics London

Sense and the City

The Sense and the City exhibition at the Transport Museum in Covent Garden opens today, and runs until March next year. It includes a number of transport visualisations contributed by the team at UCL CASA, including a themed version of my own Bike Share Map, and a similar animation I’ve done for Oyster card tap ins/outs, and also Dr Martin Zaltz Austwick’s bike movement animation. I was along with Martin (pictured above and below!) and some of the others in the team, for the private view on Wednesday.

The exhibition is in three main sections – downstairs there are a number of big screens, showing the aforementioned animations. The area is quite dark, so the graphics have come out really well. The second section is up a spiral staircase (easy to miss) where a number of touch-screen computers show more visualisations from CASA and others, each selectable by the user. The system that runs this will allow us to update the animations during the course of the exhibition, so if we do some newer related work, you may well see it here! Behind this is the last section, which is more conceptual, with a number of “visions of the future from the past” magazine covers, and other bits of futuristic transport technology – a Sinclair C5 and a “Ryno” one-wheeled motorbike. Sadly a Barclays Cycle Hire bike is not there in the flesh, but you don’t have to walk far from Covent Garden to run into them in real life. Finally, just outside the exhibition area is a “smart” bus-stop. You have to look carefully to spot the video camera, which apparently detects how much interest people are taking in the advertising panel, and adjusts its advertising appropriately.

Of course, being the transport museum, all the regular tube trains and buses are still there. The “New Bus for London” mockup is there, as is a classic Routemaster, and it would have been rude not to have gone for a ride…

Below – the Oyster card animation and Steven Gray’s Tweet-o-Meters.

Categories
Bike Share Data Graphics London

CASA on TV

Pleased that a feature on spatial data visualisation at UCL CASA has appeared as a video on the BBC News website today. It includes some work I did with Martin Austwick on animating the bike share in London – I did the routing, he did the amazing animation in Processing. It also includes visualisation of bus journeys, Oyster card taps and tweet stats for cities around the world.

Categories
Data Graphics OpenStreetMap

A Historical Comparison of OpenStreetMap’s Completeness in Britain

Dr Muki Haklay, UCL CEGE, has been carrying out some quantitative research into OpenStreetMap’s coverage in the UK, comparing road lengths in each square kilometre, with those in a definitive national dataset, Ordnance Survey Meridian 2. He’s updated his findings every few months, from March 2008 until March this year. Some interesting research findings have been found, such as a potential correlation between an area’s affluence and the map’s completeness, a possible reflection of a contributor demographic. On his suggestion I’ve taken his dataset and overlaid the red/blue under/overcompleteness maps on OpenStreetMap (or Ordnance Survey StreetView) itself, allowing the specific towns and villages that are missing the OSM love, to be identified.

The mashup can be viewed here [no longer online].

These days, OpenStreetMap’s coverage is pretty good -often exceeding Meridian’s, as service roads, private roads and alleys, that don’t exist on Meridian 2 are added in. There’s still (as of March 2011) some significant holes though, particularly in parts of Wales, the North East and East Anglia.

Note the first four maps only cover England. There is an interesting artefact in the first one – a square around London can clearly be seen, corresponding to the extent of aerial imagery, in that area, that was available via a special agreement with Yahoo for tracing. Outside of that area, only 50-year-old (out of copyright) maps and contributor GPS traces were available. Since May last year, the Ordnance Survey OpenData release, and Microsoft Bing Aerial imagery, which became available at roughly the same time, has significantly accelerated work on the map. I presented on the diverse sources of data at the Society of Cartographers annual conference last year, you can see the slides here.

ITO World’s OS Locator is just one of a number of tools that the OpenStreetMap contributor community in the UK is using to “complete” the map, moving towards the goal of a comprehensive free database of the UK’s (and world’s) streets.

Categories
Data Graphics

The iPhone Locations DB – Fun, but not Accurate

As a followup to my previous post about the (re-)discovery of the iPhone locations cache, the graphic above shows the apparent locations (of known mobile-phone masts and wifi) that were captured on my iPhone, over the last couple of weeks while I have been in Scotland. These were either independently detected by my iPhone and georeferenced using a built-in service, or, more likely as it turns out, the details of supposed nearby masts were downloaded by my iPhone from this service, based on its own location, in the hope they would subsequently be detected and allow for quick positioning.

The graphic is from my hacked version of iPhoneLocator, changed to show a higher density of dots and include the wifi data. I have superimposed on the map red lines showing where I’ve actually gone over the break. Some of the detected (or downloaded in the hope of detection) mobile-phone masts were over 40 miles away from where I actually was. Some of these may have been when I was on top of a Munro (i.e. over 3000 feet up) which therefore affords a good line of sight. Or simply, there were so few in the area, that details from the far-away ones were the best available to be obtained.

If I hadn’t drawn the red lines, you would probably be surprised to discover, for example, that I never went to Inverness during this trip (the big patch of yellow circles in the very top part of the map extract. I also never went along the various roads visible in the north, west or east part of the map, but my phone still saw the towers in these locations. So to conclude, take the detected locations with a pinch of salt. They tell you where an external database thinks a cell-phone tower once was, or where the nearest few are, even if they are a long way away. They certainly don’t tell you where you’ve actually been…

Categories
Data Graphics London

Your Life on a Map – Thanks to the iPhone

A recent discovery, revealed at the Where 2.0 conference, of a hidden file on iOS4 iPhones and iPads (and on computers that they are synchronised to) is proving to be rather interesting find. The file contains a couple of tables – ‘CellLocation’ and ‘WifiLocation’ that contain records showing times, locations and accuracies of mobile phone masts and wifi points that your phone has come across. [Update: Or more likely, ones that you might expect to come across, based on your current measured location or existing detected masts/wifi.] iPhoneTracker is a great utility which finds the file, parses and displays a gridded heatmap of the places that your iPhone thinks you’ve been to. In my case, it reveals my various trips around London, to towns in England and my travels up to and around the Scottish Highlands in the New Year.

Here’s what a bit of the wifi data on my phone looks like:

You can even see all the MAC addresses of the wifi points (and their locations/accuracies) – again this is nothing you couldn’t collect, and indeed is what Google was busy collecting with their StreetView cars, along with the 360-degree photos. Unfortunately for Google, they also collected the unencrypted data coming from some of these wifi points, which landed them in a bit of bother.

The iPhoneTracker application, as run, grids the data to 1/100th-degree latitude and longitude squares, and only looks at the mobile-phone mast data, rather than the wifi data, as the latter is more likely to be inaccurate (it’s reliant on a look-up database which can go out of date quickly). However, a simple change and recompile of the application in XCode (it’s open source) allows a more accurate map to be included, along with the wifi data if so desired.

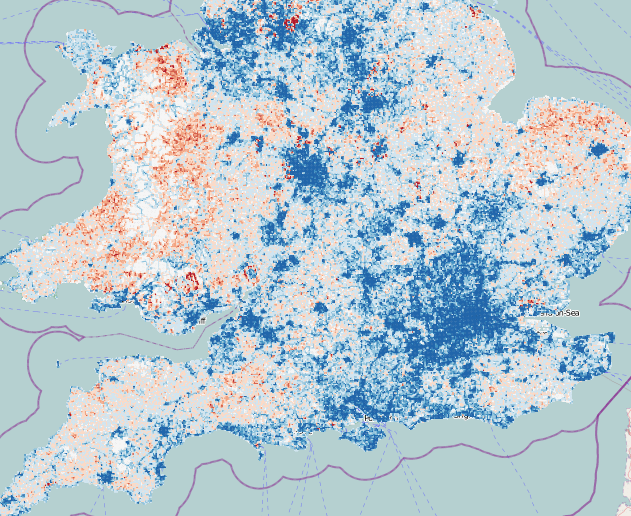
The map above shows my travels around London in the last few months, including both the mobile-phone mast and wifi data – the former is generally less accurate and so your location tends to wander, so it shows as circular clumps of small yellow dots. The latter is more concentrated so shows up as the red/purple larger dots, but in fewer locations.

As well as the positional random inaccuracy of the cell-phone triangulations, resulting in these distinctive circles of yellow dots, there is sometimes a systematic inaccuracy. I am 99% sure I haven’t been to East Ham/Barking in the last nine months, but there’s a distinctive clump around there (far right of the screenshot above.)

I’m not going to get into the debate about why Apple has persisted such a file on your phone (and in the computer backup) or whether it’s a good thing that this data is so easily accessible. It’s nothing that’s not on the mobile phone companies’ own databases. The big deal is now you can play with your own location data (and so can someone swiping your computer.) I guess if you don’t have any secrets to hide it’s a great, if imprecise, insight into your spatio-temporal life – tracking how you move around your hometown and indeed the world (my set includes my recent trips to Sicily and Prague).

The background map is from OpenStreetMap. iPhoneTracker is proving so popular, since it was revealed yesterday, that it has quadrupled the normal daily number of map images being served from the OpenStreetMap servers. The gridded visualisation is from OpenHeatMap, written by the same author as iPhoneTracker itself. It’s a great way of showing imprecise, large-volume spatial data like this.

Categories
Data Graphics

The Geography of Cheap Train Tickets

Dmitry Adamskiy has built a map of the prices of “advance-purchase” train tickets to anywhere in Great Britain, from several key locations, e.g. London, Birmingham, Liverpool. The dots on the map are colour coded from green to red depending on how cheap or expensive the fares are.

Some striking patterns appear, looking at, for instance the London departure map (shown above). The capital is surrounded by a belt of high ticket prices – the commuter belt – with cheaper tickets generally beyond. The line to King’s Lynn is expensive all the way – but the rest of East Anglia is much cheaper. Birmingham, the south coast and the west coast of Wales are also notable cheap areas. One of the Welsh Valley lines stands out as being much more expensive than the others.

Some other distinctive trends are obvious when departing from Brighton (shown below) – which is only an hour away from London. Suddenly, the eastern half of the country is consistently more expensive to visit than the west. It’s very cheap to get into London on the Southern Railway services, but expensive to visit other parts of the capital, away from the centre. Birmingham and Bristol are quite a bit cheaper cheaper than most of London.

The map can be viewed here. Click on a dot to see the station name and ticket price. There are some notes here.

The background mapping is based on OpenStreetMap. I’m not sure from where Dimitry has obtained his pricing information or station location information from.

Categories
Bike Share Data Graphics London OpenStreetMap

Boris Bikes Flow Video – Now with Better Curves!

Dr Martin Austwick and I have produced an updated version of the animation of Barclays Cycle Hire bikes on a typical weekday:

Martin has once again done some programming magic to show the River Thames, Hyde Park/Kensington Gardens and Regent’s Park to add context, plus the trails for the bike “motes” are longer, allowing the road network to be picked out more easily – and the network lines remain as faint “ghosting” in the video. The bikes are also more blue! Although the bridges aren’t specifically marked, their locations quickly become obvious from the volume of bikes crossing them.

I’ve redone the routing, to fix a few problems around Trafalgar Square and a couple of other obvious places. As before, the routing is done using OpenStreetMap data and the Routino routing scripts, optimised for bike usage (i.e constant speeds on all road types, obeying one-way roads and taking advantage of marked cycleways.) I’ve tweaked the desireability of road types, so that trunk and primary roads are now only slightly less desirable than quieter routes. The traffic in most parts of central London is so slow that, based on my own observations, such roads are not such a significant deterrent to cycling. As before, I’m assuming the bikes go along the “best” route, I don’t know where they actually went. Hires that start and end at the same point – popular in Hyde Park – are shown with the motes spinning around the point.

I’ve also included road curves this time. This means bikes don’t go in straight lines between junctions. This was particularly noticeable when they cut the corner of the Thames in the last animation! Watch the bikes as they carefully curve around the kinks of West Carriage Drive in Hyde Park, around the graceful arcs of Regent Street and Aldwych and along the Victoria Embankment. (I don’t think there are many other classic curves in the central London area?)

Expand the video to full-screen, and, if your connection can take it, click the HD button to get a higher-quality with even bluer bikes!

The data for the bikes themselves is from Transport for London, with the Thames, parks and the underlying network being faithfully drawn by OpenStreetMap contributors. One of the great advantages of using OSM data – apart from it being easy to access, is it’s often very up-to-date. For example, you can see the kink at the northern end of Blackfriars Bridge, on the animation, where the road bends around the Blackfriars Station redevelopment site.