Categories
Conferences London Mashups

On City Dashboards and Data Stores

Earlier this month, I gave a short presentation at the Big Data and Urban Informatics Workshop, which took place at UIC (University of Illinois in Chicago). My presentation was an abridged version of a paper that I prepared for the workshop. In due course, I plan to publish the full paper, possibly as a CASA working paper or in another open form. The full paper had a number of authors, including Prof Batty and Steven Gray.

Below are the slides that formed the basis of my presentation. I left out contextual information and links in the slidedeck itself, so I’ve added these in after the embedded section:

Notes

Slide 3: MapQuest map showing CASA centrally located in London.
Slides 4-5: More information.
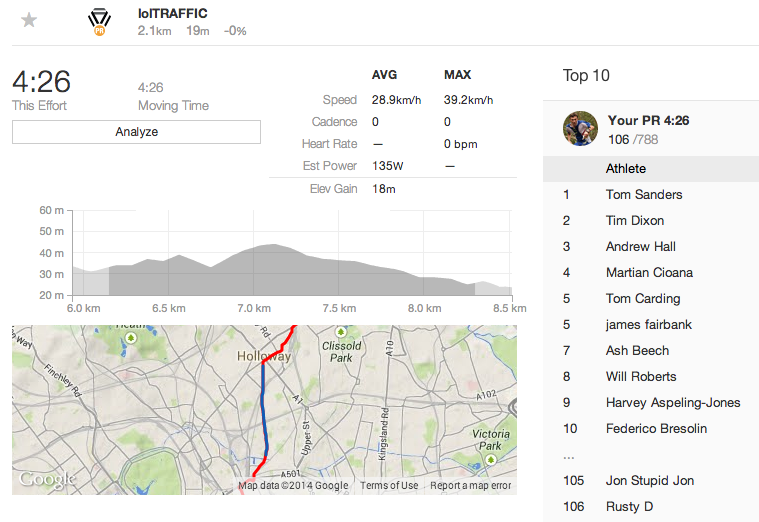
Slide 6: More information about my Bike Share Map, live version.
Slide 7: More information.
Slide 8: More information about CityDashboard, live version.
Slide 10: Live version of CityDashboard’s map view.
Slide 11: More information about the London Periodic Table, live version.
Slide 14: More information about Prism.
Slide 15: London and Paris datastores.
Slide 16: Chicago, Washington DC, Boston data portals.
Slide 17: The London Dashboard created by the Greater London Authority. Many of its panels update very infrequently.
Slide 18: Washington DC’s Open Government Dashboard and Green Dashboard, these are rather basic dashboards, the first being simply a graph and the second having just three categories.
Slide 19: The Amsterdam Dashboard created by WAAG, a non-profit computer society based in the heart of the city.
Slide 20: The Open Data City Census (US version/UK version) created by OKFN – a great idea to measure and compare cities by the breadth and quality of their open data offerings.
Slide 21: More information.
Slide 22: More information.
Slide 23: Pigeon Sim.
Slide 24: Link to iCity, More information on DataShine, live version.
Slide 25: More information on DataShine Travel to Work Flows, live version.

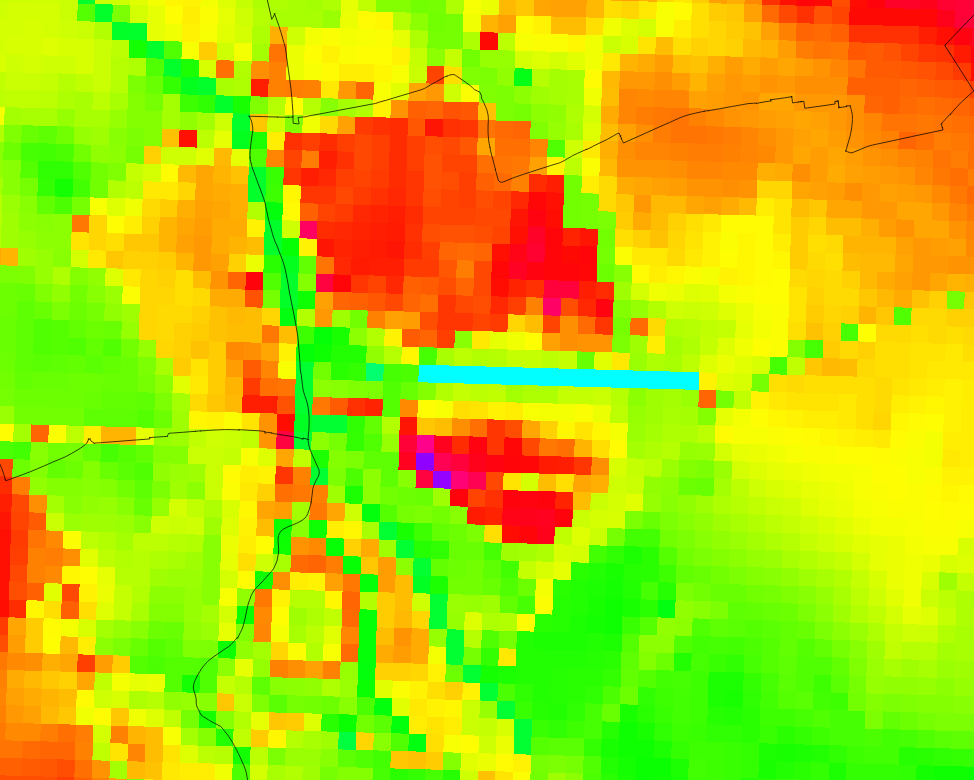
Some slides contain maps, which are generally based on OpenStreetMap (OSM) or Ordnance Survey Open Data datasets.

Categories
Cycling Training

Strava – Gamifying the Commute

Screen Shot 2014-08-07 at 14.01.32

I first tried Strava last year, comparing it to Endomondo, RunKeeper and some others, as a way of quickly pushing maps of long bike rides onto Facebook, rather than just keeping them to myself on Ascent (a standalone Mac application which has ceased development) or Garmin Connect (which wasn’t particularly sociable).

I didn’t use Strava in the end, but I’m a big convert now, because I’ve realised that Strava is not just a running/cycling route recording site, but it’s a fully fledged social network – crucially, one which is large enough to actually function as a proper social network – and best of all, they’ve basically turned London’s street network into a giant game, with “segments”. I first heard of this when a friend, who’s an active Strava user, lamenting that the Tour de France riders had wiped out various segment leaders, en masse, as they zoomed through the streets of London during the third stage of this year’s race, as some were GPS’ing their route as they went.

Segments are sections of a street – typically a long, straight section, or between two sets of slow traffic lights, or from the bottom to the top of a hill – which someone has named and designated as a segment. You then have a public leaderboard of who’s cycled/run the segment, plus your own personal statistics for the segments as well.

Despite recording my recent commutes, and back-loading various GPS’d runs and cycles into Strava, I don’t have many “CRs” (course records) for segments. But I’m pleased to hold on to two – both runs. One is along a windy road near Seven Sisters. The route/segment matching algorithm doesn’t seem to have minded that I cut a big corner near the end, even though it is obvious on the GPS trace, so has given me a comfortable 40 second cushion. The other was a short uphill section of the North Downs Way, part of a leg I ran during the NDW Relay race that my club takes part in every July. Oddly, it was a section where I made a mistake (due to OpenStreetMap inaccuracies), and veered off the route, only to have the others in the relay go past. I corrected quickly and ran hard to regain the lead, and as a useful bonus it’s given me a CR here too.

Anyway, for cycling, I may struggle to get any CRs soon, as most of these on the commute require cycling over 40km/hour, or more for sprints and descents. I’ll need to get lucky with traffic light timings, and late night empty roads. It might also encourage me to run more (which is good) and cycle faster (probably not so good). in any case, it’s made the commute a lot more fun. Thanks Strava!

Screen Shot 2014-08-07 at 14.00.01

Categories
London Technical

Borough Tops

Screen Shot 2014-08-05 at 14.49.16

The Diamond Geezer is, this month, climbing the highest tops in each one of London’s 33 boroughs.

To find the highest points, he’s used a number of websites which list the places. These derive the data from contour lines, perhaps supplemented with GPS or other measurements. However, another interesting – and new – datasource for calculating this kind of metric, is OS Terrain 50. Released as part of the Ordnance Survey Open Data packages, it is a gridded DEM (Digital Elevation Model). It’s right up to date, at 50m x 50m horizontal resolution, and 10cm vertical resolution, and it should correct for buildings, so showing the true ground height.

Looking at the DEM for Newham, I think it reveals a new highest point – not Wanstead Flats at 15m above sea level, as Diamond Geezer’s lists suggest, but Westfield Avenue, the new road that runs through the Olympic Park. Beside John Lewis, the road rises, to a highest point of 21.6m. It shows as purple in the graphic above. Nearby, the new “bowl” of the lower part of the Olympic Stadium can be seen, as well as the trench through which High Speed 1 runs, at Stratford International Station.

I can’t argue with the Chancery Lane/Holborn junction as being the highest ground-point in the City of London, at 21.9m. In Tower Hamlets, it’s more tricky. The old railyards between Shoreditch High Street and the lines into Liverpool Street look like they are at 21.7m, however the ground here is not publically accessible, and the DEM is quite noisy here, with only part of the railyard showing this height.

I’m looking for a way to do this programatically – calculating the highest DEM value for each borough. I’ve tried using QGIS’s Zonal Statistics plugin, with polygon shapefiles of London’s boroughs, but this only shows the mean value of the DEM for that borough.

Here’s the list I’ve created by measuring – the main issue with my dataset is that the measurements are only at the centre of each 50m x 50m cell.

Borough Hgt (m) 50m cn 10-digit grid ref Description of
approximate location
By edge?
Barking and Dagenham 45.3 TQ_48590_89948 Industrial area just E of northern part of Whalebone Lane North.
Barnet 146.1 TQ 21955 95622 Just south of the water tower to the east of Rowley Lane, near Rowley Green.
Bexley 81 TQ 45737 71256 Langdon Shaw, southwest side. Yes
Brent 91.2 TQ 20732 88877 Junction of Wakemans Hill Avenue and The Grove.
Bromley 246.5 TQ 43637 56487 A233 – where Main Road changes name to Westerham Hill Yes
Camden 135.6 TQ 26277 86225 Lower Terrace, just off Heath Street in Hampstead. Yes
City of London 21.9 TQ 30970 81612 NW edge – junction of Holborn and Chancery Lane.
Croydon 175.7 TQ 34330 61827 Sanderstead Plantation, SW path crossroads.
Ealing 81.5 TQ 16177 84398 Horsenden Hill
Enfield 118.7 TQ 25632 97674 Just north of Camlet Way, Hadley Wood, opposite Calderwood Place. Yes
Greenwich 131.1 TQ 43831 76583 Southern end of Eaglesfield Recreation Ground on Shooters Hill.
Hackney 39.8 TQ 32025 87574 In Finsbury Park, beside Green Lanes, opposite No. 330. Yes
Hammersmith and Fulham 45.9 TQ 22960 82756 Harrow Road at north end of bridge over the railway line near Kensal Green station. Yes
Haringey 129 TQ 28326 87479 Ground by Highgate School Chapel, just north of Highgate High Street.
Harrow 153.4 TQ 15288 93808 Magpie Hall Road, between The Common and Alpine Walk. Yes
Havering 106 TQ 51192 93055 Churchyard of St John the Evangelist church (also Broxhill Road by the cricket pitch)
Hillingdon 130.5 TQ 10585 91678 Junction of South View Road and Potter Street Hill Yes
Hounslow 33.6 TQ 11320 78815 Western Road – bridge over the Grand Union Canal.
Islington 99.9 TQ 28874 87217 Highgate Hill and Hornsey Lane junction. Yes
Kensington and Chelsea 45.7 TQ 23014 82728 Kensal Green Cemetery, northern edge, beside the Harrow Road, above the railway line. Yes
Kingston upon Thames 91.3 TQ 16644 60376 Telegraph Hill
Lambeth 110.9 TQ 33620 70729 Westow HIll and Japser Road junction. Yes
Lewisham 111.2 TQ 33918 71779 Sydenham Hill and Rock Hill junction. Yes
Merton 56 TQ 23627 70823 Lauriston Road and Wilberforce Way NW junction.
Newham 21.6 TQ 37967 84530 Westfield Avenue, outside John Lewis in Westfield Stratford City.
Redbridge 91.5 TQ 47945 93784 Cabin Hill
Richmond upon Thames 56 TQ 18779 73065 Bridleway/path junction just east of Queens Road, opposite the Pembroke Lodge car-park and to the NE of it.
Southwark 111.5 TQ 33926 71686 Sydenham Hill, between Chestnut Place and Bluebell Close. Yes
Sutton 146.4 TQ 28383 59986 Middle of rectangle of land south-east of Corrigan Avenue and south-west of Richland Avenue.
Tower Hamlets 21.7 TQ 33720 82184 Railway yards between Shoreditch High Street station and the railways lines leading to Liverpool St Station.
Waltham Forest 92.2 TQ 38415 95010 Pole Hill (north top)
Wandsworth 60.7 TQ 22881 72780 Big Alp, Wimbledon Common
Westminster 53 TQ 26627 18386 Finchley Road and Boundary Road junction. Yes