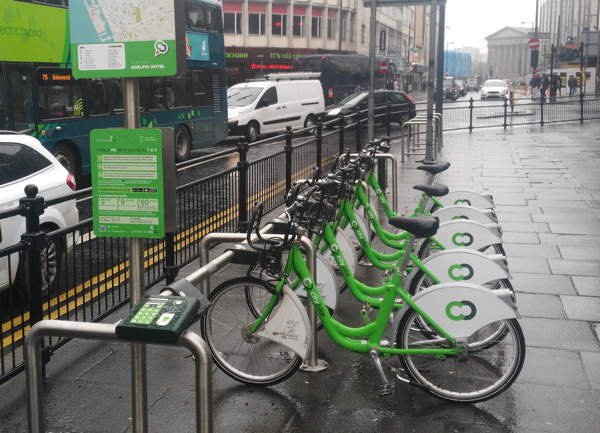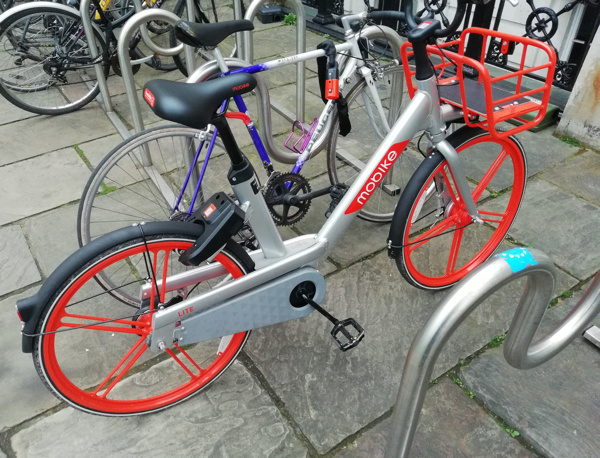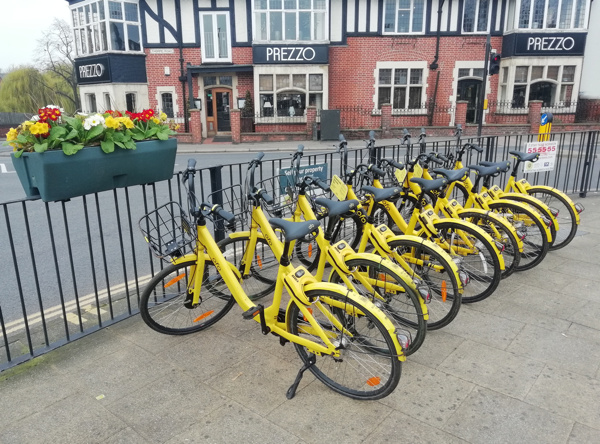
There’s lots of bikeshare systems in the UK now. As well as the third generation dock-based bikeshare systems, fourth generation dockless (and hybrid) systems are starting to appear on various streets around the country, led by Mobike, Ofo and Urbo, three dockless providers and operators.
I’ve put together this simple model to try and understand where systems are most likely to be successful, for which I’m defining as a lot of (legal) journeys made with each bike placed by the operator. To do this, I split the country into its local authorities, apply three scores, and then multiply them together to produce an overall “propensity for bikeshare”, or PFB score (the name is a nod to PCT.bike from Lovelace et al) which can then be ranked.
Many mid-sized cities in the UK have their own local authority, approximately covering the urban area, while Manchester and London are split into multiple LAs. Conversely, some LAs individually cover multiple smaller towns/cities and large rural areas too. Hence, this is a very simply model which is not going to be completely fair to every urban area (Stirling, in particular, gets pushed well down the rankings as its LA includes a huge rural area). Still, for most of Great Britain, it produces results I would anticipate and is a good start towards potentially developing a more sophisticated model. The local authority geography is also appropriate, as local authorities act as the gatekeepers for which access is negotiated (for systems which pay themselves) or as authors of bids for subsidised systems.

Model Inputs
For this first, simple model, my three compounding factors are:
- Residential and workplace population density – on the assumption that bikeshare systems need a critical mass of people passing by their bikes/hubs/docks, in order to be seen and used sufficiently frequently to justify the costs of equipment/maintenance, on the basis that a major source of income is per-use fees. Both residential and workplaces populations are used, as people have journey opportunities that can be facilited with bikeshare, both from their office (e.g. lunchtime errands, commute to evening socialising or back home) as well as their home location.
- Proportion of people who already commute by bicycle, again looking at both workplace location and residential location (bearing in mind that many commute journeys, particularly in London, cross local authority boundaries). While such people are less likely to convert to bikeshare, as they already have a means of cycling, their presence on the streets and associated culture and facilities (e.g. bike coffee shops, marked cycle routes or existing cycle-friendly infrastructure) help normalise the idea that cycling is a possible option for a journey need.
- Vandalism rate – theft and criminal damage to bikeshare bikes happens and it is an expensive one for the operators. It can be what causes systems to fail – particularly if they run out of bikes, or broken bikes litter the landscape and turn public opinion against the concept. While the dock-based systems are less vulnerable to this, as the bike is either securely locked to a clamp or in the hands of a paying user, dockless bikes are particularly vulnerable to vandalism, as they are not secured to immoveable objects, and their locks are, unfortunately, relatively easy to break by a determined offender looking for a free bike. The tendencies for vandalism of property that is not yours does vary significantly around Great Britain, while stereotypically it is likely to be more urban areas and areas with a younger and less educated population that is more likely to vandalise, using actual crime data on vandalism allows a more nuanced approach to be taken. Other crime classes (e.g. theft) were also considered for this model, but I think that vandalism rates act as a good proxy for how the local population around a bikeshare system will “care” for it or abuse it.
I have not included the absolute populations of local authorities in the calculation, as in general, with one exception (Isle of Scilly), LAs all have a significant night and/or day population, so they are all large enough to have a self-contained system. Another obvious factor, hilliness, is likely already correlated with proportion of cycling commuters and so is not included. N.I. is excluded from the model for now. Data sources include the latest police crime statistics (with populated-weighted averaging when across multiple LAs), and census data.
Results: Propensity for Bikeshare by Local Authority
Here are the results of the model run. Clicking an underlined title takes you to the main bikeshare for that area – forthcoming systems in brackets.
Some notes:
- London boroughs score consistently highly, and even London as a whole, which is interesting as outer London is anecdotally not known as a particularly cycling-friendly place. Considering the size of the city, and the intimidating conditions cyclists often have to put up with in much of the capital, it is great to see it scoring so highly here.
- Bikeshare operators are doing their homework and generally, the top end of the list is already well populated with bikeshare systems, in some cases multiple systems are competing.
- The top local authorities without a bikeshare system (operating, announced or consulting) are Haringey, a north-London inner-city borough which has been surprisingly quiet until now, and Merton, an affluent outer London borough to the south. Oustide of London, the highest ranking areas without a bikeshare are Portsmouth (small system launching this summer), Gosport (neighbouring), Gloucester, Poole, Worcester and Hull. With the exception of Hull, these are all southern English urban areas, with generally affluent populations and some established cycling culture.
See also my London borough bikeshare scorecard.

2 replies on “Where Might Bikeshare Succeed in Great Britain?”
Love this! Thank you for sharing such an insightful article!
[…] risk/reward of operating in different London boroughs. This analysis is an alternative approach to a previous model that looked specifically at general vandalism rates and usage rates, because it looks at the daytime […]