Categories
Technical

OpenLayers 3 and Vector Data

As part of a project to move most of my OpenLayers 2-powered websites to OpenLayers 3, I have recently converted two more – DataShine: Travel to Work Flows and the North/South Interactive Map. Unlike the main DataShine: Census website, both of these newer conversions include vector geospatial data, so there was additional learning involved during the migration process, mainly relating to vector styling.

northsouth2North/South Interactive Map

For the North/South Interactive Map, I made use of the loading in of remote GeoJSON files.

Vector Layers

Here’s a vector layer:

layerPoints = new ol.layer.Vector({
    source: pointSource,
    style: function(feature, res) { return pointStyle(feature, res); }
});

The pointSource is a ol.source.GeoJSON, which requires the projection of the files to be defined, as well as that to be displayed, when defining the source for the Vector layer:
pointSource = new ol.source.GeoJSON({
    url: '...',
    defaultProjection: 'EPSG:4326',
    projection: 'EPSG:3857',

    attributions: [ new ol.Attribution({ 'html': "..." }) ]
});

If you wish to do further operations on your data once it is loaded in, you need to add a listener to a remotely loaded (e.g. GeoJSON file) source included within a Vector layer:

pointSource.once('change', function()
{
    if (pointSource.getState() == 'ready')
    { var features = pointSource.getFeatures(); ... }
};

Here’s a typical style function. I’m using a property “highlight” on my feature to style such features differently:

function pointStyle(feature, resolution)
{
    return [
        new ol.style.Style({
            image: new ol.style.Circle({
                radius: (feature.highlight ? 7 : feature.radius ),
                fill: new ol.style.Fill({ color: feature.fillColor }),
                stroke: new ol.style.Stroke({ width: feature.strokeWidth, color: '#fff' })
            }),
            text: new ol.style.Text({
                text: (feature.highlight ? feature.label : ""),
                font: '9px Ubuntu, Gill Sans, Helvetica, Arial, sans-serif',
                fill: new ol.style.Fill({ color: '#fff' })
            })
        })
    ]
};

Interactions

To detect clicks, I used an ol.interaction.Select – N.B. if you don’t specify which layers it applies to, it tries to apply them to all Vector layers!

var selectClick = new ol.interaction.Select({
    condition: ol.events.condition.click,
    style: function(feature, res) { return pointStyle(feature, res); },
    layers: [layerPoints]
});

selectClick.getFeatures().on('change:length', function(e)
{ ... }

olMap.addInteraction(selectClick);

In my function here I remove the flag from any already highlighted features and call features[i].changed(); to get the non-highlighed style. You don’t need to call this on what you’ve actually clicked on, as this is done implicitly. here’s likely better ways of showing selected/highlighted features, using ol.FeatureOverlay, but i couldn’t get this to work.

coordinates

MousePosition

There’s quite a nice new utility function which means it was little effort to get an “old style” location indicator in, at the bottom of the North/South interactive:
new ol.control.MousePosition({ projection: "EPSG:4326", coordinateFormat: ol.coordinate.toStringHDMS, className: 'olControlMousePosition' })

ttwf

DataShine: Travel to Work Flows

This loads vector data in as generic JSON through a regular (non-OL) AJAX call rather than GeoJSON so the processing is a bit more manual. This time, my source for the Vector layer is a simple ol.source.Vector which can be emptied with source.clear(); and reused.

I’m creating lines directly from the JSON, converting from OSGB grid and specifying colour (for the style) as I go – note my use of rgba format, allowing me to specify a partial transparency (of 60%) for the lines:

var startLL = ol.proj.transform([data[start][2], data[start][3]], "EPSG:27700", "EPSG:3857");
var endLL = ol.proj.transform([data[end][2], data[end][3]], "EPSG:27700", "EPSG:3857");
var journeyLine = new ol.geom.LineString([startLL, endLL]);
var lineItem = new ol.Feature({ geometry: journeyLine });
lineItem.strokeColor = 'rgba(255, 0, 0, 0.4)'; lineSource.addFeature(lineItem);

As previously blogged, I’m also using hand-crafted permalinks in both websites, and drag-and-drop KML display and UTF grid mouseovers in the latter, and both have also had their stylesheets tweaked to allow for easy printing – again made possible with OL3.

I’m about ready now to tackle my most complicated OpenLayers project by far, the Bike Share Map.

Categories
BODMAS OpenLayers Technical

OpenLayers 3 and DataShine

ds_ol3

OpenLayers is a powerful web mapping API that many of my websites use to display full-page “slippy” maps. DataShine: Census has been upgraded to use OpenLayers 3. Previously it was powered by OpenLayers 2, so it doesn’t sound like a major change, but OL3 is a major rewrite and as such it was quite an effort to migrate to it. I’ve run into issues with OL3 before, many of which have since been resolved by the library authors or myself. I was a bit grumbly in that earlier blogpost for which I apologise! Now that I have fought through, the clouds have lifted.

Here are some notes on the upgrade including details on a couple of major new features afforded by the update.

New Features

Drag-and-drop shapes

One of the nicest new features of OL3 is drag-and-dropping of KMLs, GeoJSONs and other geo-data files onto the map (simple example). This adds the features pans and zooms the map to the appropriate area. This is likely most useful for showing political/administrative boundaries, allowing for easier visual comparisons. For example, download and drag this file onto DataShine to see the GLA boundary appear. New buttons at the bottom allow for removal or opacity variation of the overlay files. If the added features include a “name” tag this appears on the key on the left, as you “mouse over” them. I modified the simple example to keep track of files added in this way, in an ol.layer.Group, initially empty when added to the map during initialisation.

Nice printing

Another key feature of OL3 that I was keen to make use of is much better looking printing of the map. With the updated library, this required only a few tweaks to CSS. Choosing the “background colours” option when printing is recommended. Printing also hides a couple of the panels you see on the website.

Nice zooming

OL3 also has much smoother zooming, and nicer looking controls. Try moving the slider on the bottom right up and down, to see the smooth zooming effect. The scale control also changes smoothly. Finally, data attributes and credits are now contained in an expandable control on the bottom left.

A bonus update, unrelated to OL3, is that I’ve recreated the placename labels with the same font as the DataShine UI, Cabin Condensed. The previous font I was using was a bit ugly.

Major reworkings to move from OL2 to OL3

UTF Grids

With OpenLayers 3.1, that was released in December 2014, a major missing feature was added back in – support for UTF Grid tiles of metadata. I use this to display the census information about the current area as you “mouse over” it. The new implementation wasn’t quite the same as the old though and I’ve had to do a few tricks to get it working. First of all, the ol.source.TileUTFGrid that your UTF ol.layer.Tile uses expects a TileJSON file. This was a new format that I hadn’t come across before. It also, as far as I can tell, insists on requesting the file with a JSONP callback. The TileJSON file then contains another URL to the UTF Grid file, which OL3 also calls requiring a JSONP callback. I implemented both of these with PHP files that return the appropriate data (with appropriate filetype and compression headers), programmatically building “files” based on various parameters I’m sending though. The display procedure is also a little different, with a new ol.source.TileUTFGrid.forDataAtCoordinateAndResolution function needing to be utilised.

In my map initialisation function:

layerUTFData = new ol.layer.Tile({});

var handleUTFData = function(coordinate)
{
  var viewResolution = olMap.getView().getResolution();
  layerUTFData.getSource().forDataAtCoordinateAndResolution(coordinate, viewResolution, showUTFData);
}

$(olMap.getViewport()).on('mousemove', function(evt) {
  var coordinate = olMap.getEventCoordinate(evt.originalEvent);
  handleUTFData(coordinate);
});

In my layer change function:

layerUTFData.setSource(new ol.source.TileUTFGrid({
  url: "http://datashine.org.uk/utf_tilejsonwrapper.php?json_name=" + jsonName
})

(where jsonName is how I’ve encoded the current census data being shown.)

Elsewhere:

var callback = function(data) { [show the data in the UI] }

In utf_tilejsonwrapper.php:

<?php
header('Content-Type: application/json');
$callback = $_GET['callback'];
$json_name = $_GET['json_name'];
echo $callback . "(";
echo "
{ 'grids' : ['http://datashine.org.uk/utf_tilefilewrapper.php?x={x}&y={y}&z={z}&json_name=$json_name'],
'tilejson' : '2.1.0', 'scheme' : 'xyz', 'tiles' : [''], 'version' : '1.0.0' }";
echo ')';
?>

(tilejson and tiles are the two mandatory parts of a TileJSON file.)

In utf_tilefilewrapper.php:

<?php
header('Content-Type: application/json');
$callback = $_GET['callback'];
$z = $_GET['z'];
$y = $_GET['y'];
$x = $_GET['x'];
$json_name = $_GET['json_name'];
echo $callback . "(";
echo file_get_contents("http://[URL to my UTF files or creator service]/$json_name/$z/$x/$y.json");
echo ')';
?>

Permalinks

The other change that required careful coding to recreate the functionality of OL2, was permalinks. The OL3 developers have stated that they consider permalinks to be the responsibility of the the application (e.g. DataShine) rather than the mapping API, and, to a large extent, I agree. However OL2 created permalinks in a particular way and it would be useful to include OL3 ones in the same format, so that external custom links to DataShine continue to work correctly. To do this, I had to mimic the old “layers”, “zoom”, “lat” and “lon” parameters that OL2’s permalink updated, and again work in my custom “table”, “col” and “ramp” ones.

Various listeners for events need to be added, and functions appended, for when the URL needs to be updated. Note that the “zoom ended” event has changed its name/location – unlike moveend (end of a pan) which sits on your ol.map, the old “zoomend” is now called change:resolution and sets on olMap.getView(). Incidentally, the appropriate mouseover event is in an OL3-created HTML element now – olMap.getViewport() – and is mousemove.

Using the permalink parameters (args):

if (args['layers']) {
  var layers = args['layers'];
  if (layers.substring(1, 2) == "F") {
    layerBuildMask.setVisible(false);
  }
  [etc...]
}
[& similarly for the other args]

On map initialisation:

args = []; //Created this global variable elsewhere.
var hash = window.location.hash;
if (hash.length > 0) {
  var elements = hash.split('&');
  elements[0] = elements[0].substring(1); /* Remove the # */
  for(var i = 0; i < elements.length; i++) {     var pair = elements[i].split('=');     args[pair[0]] = pair[1];   } }

Whenever something happens that means the URL needs an update, call a function that includes this:

var layerString = "B"; //My old "base layer"
layerBuildMask.getVisible() ? layerString += "T" : layerString += "F";
[etc...]
layerString += "T"; //The UTF data layer.
[...]
var centre = ol.proj.transform(olMap.getView().getCenter(), "EPSG:3857", "EPSG:4326");
window.location.hash = "table=" + tableval + "&col=" + colval + "&ramp=" + colourRamp + "&layers=" + layerString + "&zoom=" + olMap.getView().getZoom() + "&lon=" + centre[0].toFixed(4) + "&lat=" + centre[1].toFixed(4);
}

Issues Remaining

There remains a big performance drop-off in panning when using DataShine on mobile phones and other small-screen devices. I have put in a workaround "viewport" meta-tag in the HTML which halves the UI size, and this makes panning work on an iPhone 4/4S, viewed horizontally, but as soon as the display is a bit bigger (e.g. iPhone 5 viewed horizontally) performance drops off a cliff. It's not a gradual thing, but a sudden decrease in update-speed as you pan around, from a few per second, to one every few seconds.

Additional Notes

Openlayers 3 is compatible with Proj4js version 2 only. Using this newer version requires a slightly different syntax when adding special projections. I use Proj4js to handle the Ordnance Survey GB projection (aka ESPG:27700), which is used for the postcode search, as I use a file derived from the Ordnance Survey's Code-Point Open product.

I had no problems with my existing JQuery/JQueryUI-based code, which powers much of the non-map part of the website, when doing the upgrade.

Remember to link in the new ol.css stylesheet, or controls will not display correctly. This was not needed for OL2.

OL3 is getting there. The biggest issue remains the sparsity of documentation available online - so I hope the above notes are helpful in the interim.

ds_ol3overlay2

Above: GeoJSON-format datafiles for tube lines and stations (both in blue), added onto a DataShine map of commuters (% by tube) in south London.
Categories
OpenStreetMap Orienteering

OOM 2.3 – Automatic Postbox Additions

postboxes

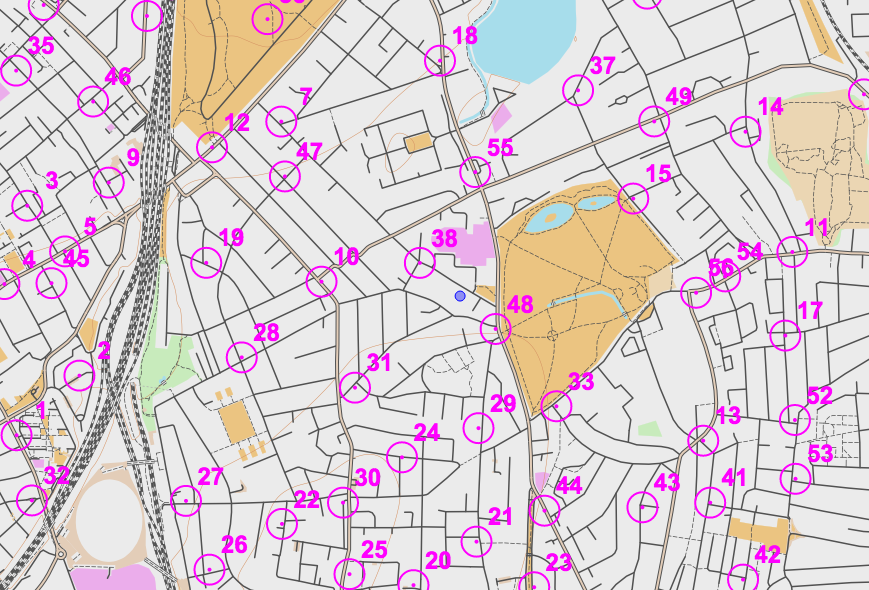
As a fun project for OpenOrienteeringMap (OOM) during the Christmas pause, I incorporated a feature requested on the forums of NopeSport that I had actually also been thinking about myself – the automated addition of controls. I’m using Nearest Postbox which is a tool written by the polycoder Matthew Somerville to show postboxes in OpenStreetMap augment with reference numbers and other data. If you zoom into an area on the UK edition of OOM and click to add a map “sheet”, you can then click on the “Add Postboxes” button. OOM will make use of Matthew’s API to his site, to pull in known postbox locations and create controls from them. You’ll only be able to do this if there are not any controls already added. You can then edit/delete the controls (e.g. change the score) in the normal way.

postboxes_button

Some Street-O events by SLOW and other clubs already use postboxes as useful controls. This will hopefully make it more easy for the planner, although they’ll still need to visit the postboxes concerned to verify the ref and make sure the postbox is still there…

The feature is experimental, so if you run into any bugs please tell me.

Categories
London Olympic Park

Queen Elizabeth Olympic Park – New Bridge

IMG_1461ce

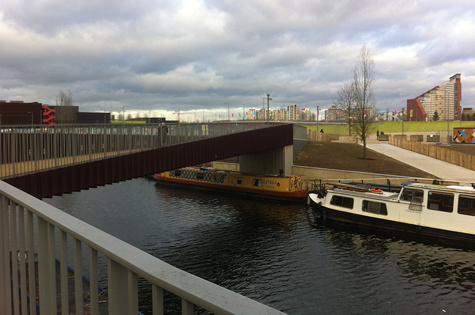
There’s a new bridge into the Queen Elizabeth Olympic Park – the Monier Bridge. It connects Monier Road in Fish Island, part of Hackney Wick, with the Loop Road in the Olympic Park. At the latter connection point there is a new ramp down to the canal towpath and also a path through the Sweetwater development site, to Carpenters Lock which is the focal point of the whole park, as it connects the main north and south parts. The new bridge was actually installed a couple of years ago, but it has taken a long time to open up the area of the park north-west of the Olympic Stadium and so provide the link through to the centre.

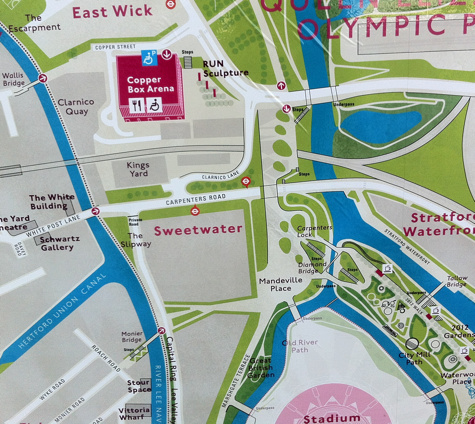
The bridge’s design mirrors that of the Wallis Bridge which connects the northern half of Hackney Wick to the park. A map, that I found on hoardings beside another bridge in the park which is being narrowed, shows both new bridges (on the extract of the map below, they are both on the left-hand side) and also reveals new names for several other bridges in the park. The bridge to the Waterpolo arena, aka the Stratford Waterfront development site, is now called Tallow Bridge. Further downstream, the Aquatic Bridge and Purple Bridge become the Thornton Bridge and Iron Bridge respectively.

IMG_1488c

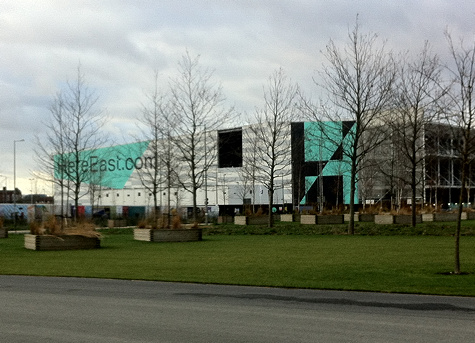
Elsewhere, I noticed that the hoardings around the Sweetwater development site have a new mural on them. There is also a new ramp down to the canal from the White Post Lane entrance, alongside the existing steep and cobbly one. There are also five new level paths connecting the canal with the old Main Press Centre building. The larger building alongside, Here East, which has previously always been a drab white and grey, has a huge “H” painted in black and green on its southern face, along with a huge “HereEast.com” graphic.

With the new bridge having opened above, and Carpenters’ Road finally reopened under the mainline railway, the Queen Elizabeth Olympic Park finally has all almost all of its entrances open – it’s somewhat challenging to count them all, but there’s at least 30 now, depending on how the boundaries are defined. Certainly, this is a big piece of London which is now a lot more connected – and a lot less secluded – than it was back in 2007.

IMG_1484ce

Categories
Data Graphics London

North/South – The Interactive Version.

northsouth_large

As a weekend project, I’ve made an interactive version of my London North/South artwork.

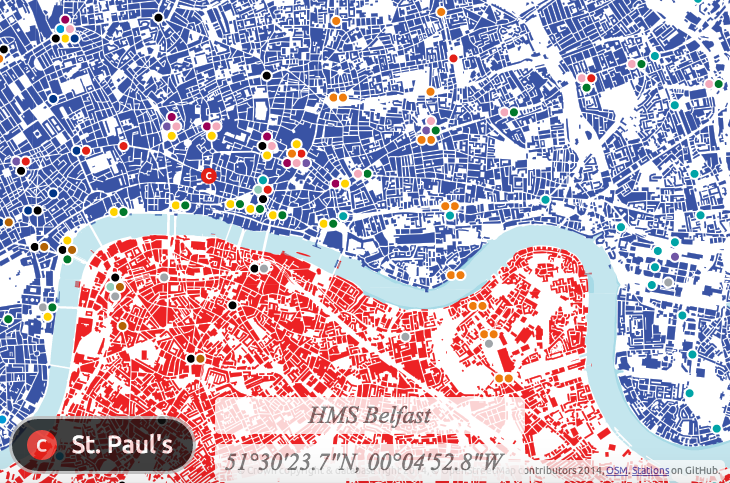
As well as the blue and red house silhouettes, assembled in QGIS, I’ve added in GeoJSON files of the River Thames (from Ordnance Survey Vector Map District, like the buildings) and of tube/DLR/Overground stations – the location/name/network data is from this GitHub file and I’ve applied a custom styling in OpenLayers 2, with station name styling inspired by the NYC Subway signs. The positional information comes from an OpenLayers control – I’m using a utility function to modify the output to use degrees, minutes and seconds. Finally, the naming popup is a set of UTFGrid JSON files (with 2-pixel resolution) based on OpenStreetMap data for polygons. Where the polygon has a building, leisure or waterway tag, I’m extracting a name, if available, and showing it. The coverage here is therefore only as good as building naming is in OpenStreetMap. I could potentially add in street names in the future.

Try it out here.

Categories
OpenStreetMap

Primary Roads

a1a6_london

Britain’s “top” primary roads – the A1, A2, A3… to A9 – are arranged in a particular pattern, with the A1-A6 radiating out clockwise from London and the A7 to A9 similarly radiating around Edinburgh.

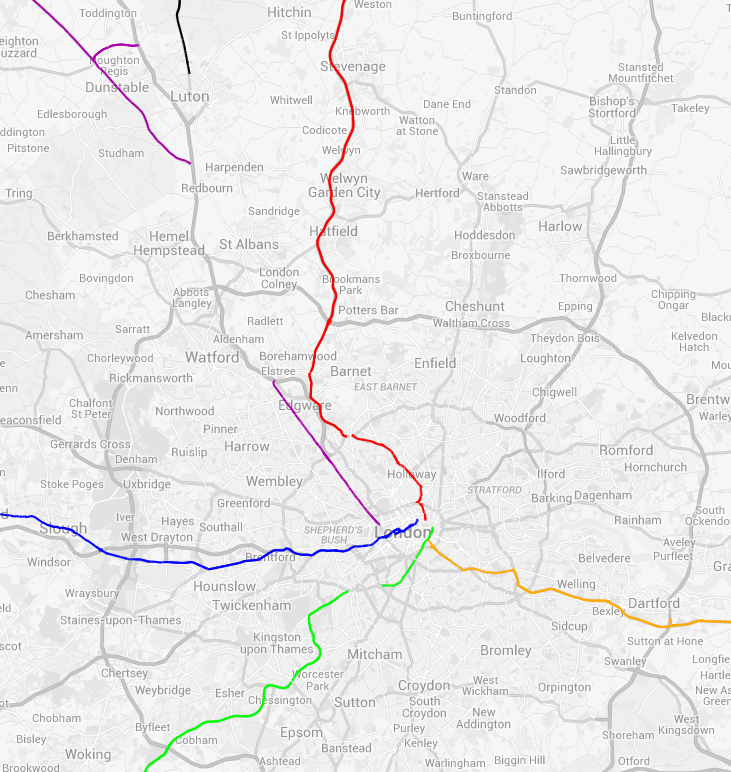
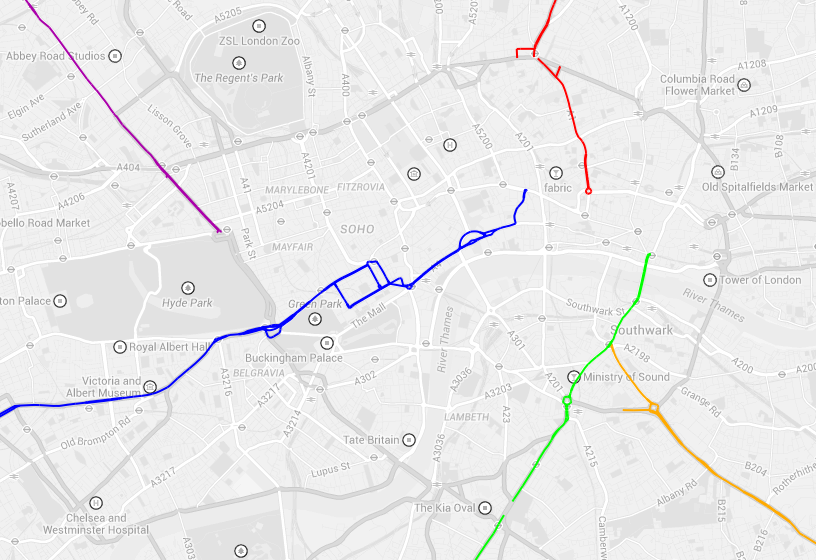
I used Gemma, an old UCL CASA project that Steve and I worked on back in 2011, to draw, from OpenStreetMap, the routes of the A1-A6 as they leave London. The A5 has a gap between Edgware and Harpenden, and the A6 only starts at Luton – both of these changes likely due to the building of the M1 motorway which effectively replaced those sections. Co-numbered roads are not included in the map due to a conflict with the way OpenStreetMap and Gemma separate information. Key for the maps: Red = A1, Orange = A2, Green = A3, Blue = A4, Purple = A5, Black = A6.

Also of interest is that the only two roads that “touch” in London are the A2 and A3, at Borough. The other roads may at one time have converged at junctions, but their starts have been shortened slightly over the years. The big junction at Bank certainly looks like a place where the A1, A3 and A4 could have started from. (Outside of London, the A7 touches the A1 at its northern end and the A6 at its southern end.) Diamond Geezer walked the first mile of the A1-A5 a few years ago.

Gemma still partially works, despite not having seen much love for the last few years and having never made it out of beta (it was a short project). It is recommended you use the OpenStreetMap (or Marker) layers only, to avoid bugs, and watch out if removing layers. You can see the live A1-A6 map here or have a go at building your own.

a1a6_detail

Key for the maps: Red = A1, Orange = A2, Green = A3, Blue = A4, Purple = A5, Black = A6.

I’ve blogged about Gemma before (more).

The coloured road lines are Copyright OpenStreetMap contributors and the greyscale background map is Copyright Google.

Categories
OpenStreetMap Orienteering

OOM on OpenCageData

I was interviewed by OpenCageData recently, the article appears on their blog and I have reproduced it here:

Continuing in our series of interviews with folks doing interesting things in the open geo world, today we enter the realm of domain specific OpenStreetMap variants by talking with Oliver O’Brien, maker of Open Orienteering Map.

1. Who are you and what do you do? What got you into OpenStreetMap?

I’m Oliver O’Brien (“Ollie” on OpenStreetMap). I’m a researcher and software developer at the Department of Geography at UCL in London, specialising in geovisualisation and demographic mapping.

I’ve been a contributor to the OpenStreetMap project since 2007. I first learnt about it when a friend was keen to try out lots of different routes around Edinburgh during the Hogmanay festival, recording them with a GPS receiver. He explained he was uploading them to a project – OpenStreetMap – a map that anyone can edit. At the time it was nearly blank in the Edinburgh area. When I got back to London I discovered that many of the roads in my local area were missing too, so got down to filling them in. At the time, the project did not have access to high-resolution aerial imagery, so GPS traces were very useful – as were annotating note by hand on various scraps of paper! I then discovered the thriving London OpenStreetMap community – we organise mapping parties, though now, as London is largely “done”, it’s generally pub meets. I’m lucky enough to regularly use OpenStreetMap data for my day job at UCL, sometimes including my own contributions.

2. What is Open Orienteering Map? What is the goal of the project?

My orienteering club (South London Orienteers, aka SLOW) has been running informal “Street-O” evening training events in various parts of London, for many years. The idea is that you have to visit as many points, marked on a printed map that you run with, as possible within one hour, and get back to the start. The route you take is up to you, so it’s vital that the map you use doesn’t get you lost. Many of the maps being used at the time I first joined the club were created in fiddly (and expensive) bespoke software used for professional maps, typically by hand, tracing in A-Z or Ordnance Survey paper maps. The process was prone to error and very slow.

Having seen OpenStreetMap data being used in various other projects, such as Andy Allan’s OpenCycleMap, I realised there was potential for it to be used for orienteering mapping too. While regular orienteering maps contain a lot of specialist features not on OpenStreetMap (such as forest thickness and crag detail), basic Street-O maps are simpler, and for many areas, OpenStreetMap likely has sufficient level of detail. Initially I set up a system which required GIS software to use, with appropriate orienteering styles and filters, but that was still hard to use for people outside the GIS world, so I then realised I could go one step further and build a website – http://oomap.co.uk– that performed the same function. So OpenOrienteeringMap was born.

The goal of the project is to make it as easy as possible for the volunteer Street-O organisers to create maps for their events. This has two main benefits – firstly, with less spent time on drawing the map, and no cartography skills needed – the website generates a PDF map to print, at the click of a button – more new people can get involved and organise their own event, taking time to plan great courses rather than draw a map. Additionally, it encourages new people into the OpenStreetMap community. By making the only easy way for organisers to update the roads, paths and other features on the Street-O map being via OpenStreetMap – with a regular refresh of the database back to OpenOrienteeringMap – the website has got a few people hooked on being “regular” OpenStreetMap editors, as well as orienteers. (N.B. if I rebuilt the service now from scratch I would probably use something the Overpass API and vector tiles directly in the browser, rather than have my own copy of the database and an image tiler and PDF generator.)

There are three versions of the website: British (with OS Open Data contours), Irish and worldwide, and two main mapping styles, “StreetO”, used for Street-O races, and “PseudO”, which is an attempt to create a “regular” orienteering map style in OpenOrienteeringMap, following the colour and symbol standards defined by the sport. It has a distinctive look but is of less use for orienteering events except in a few very well-mapped places. The styles are on GitHub.

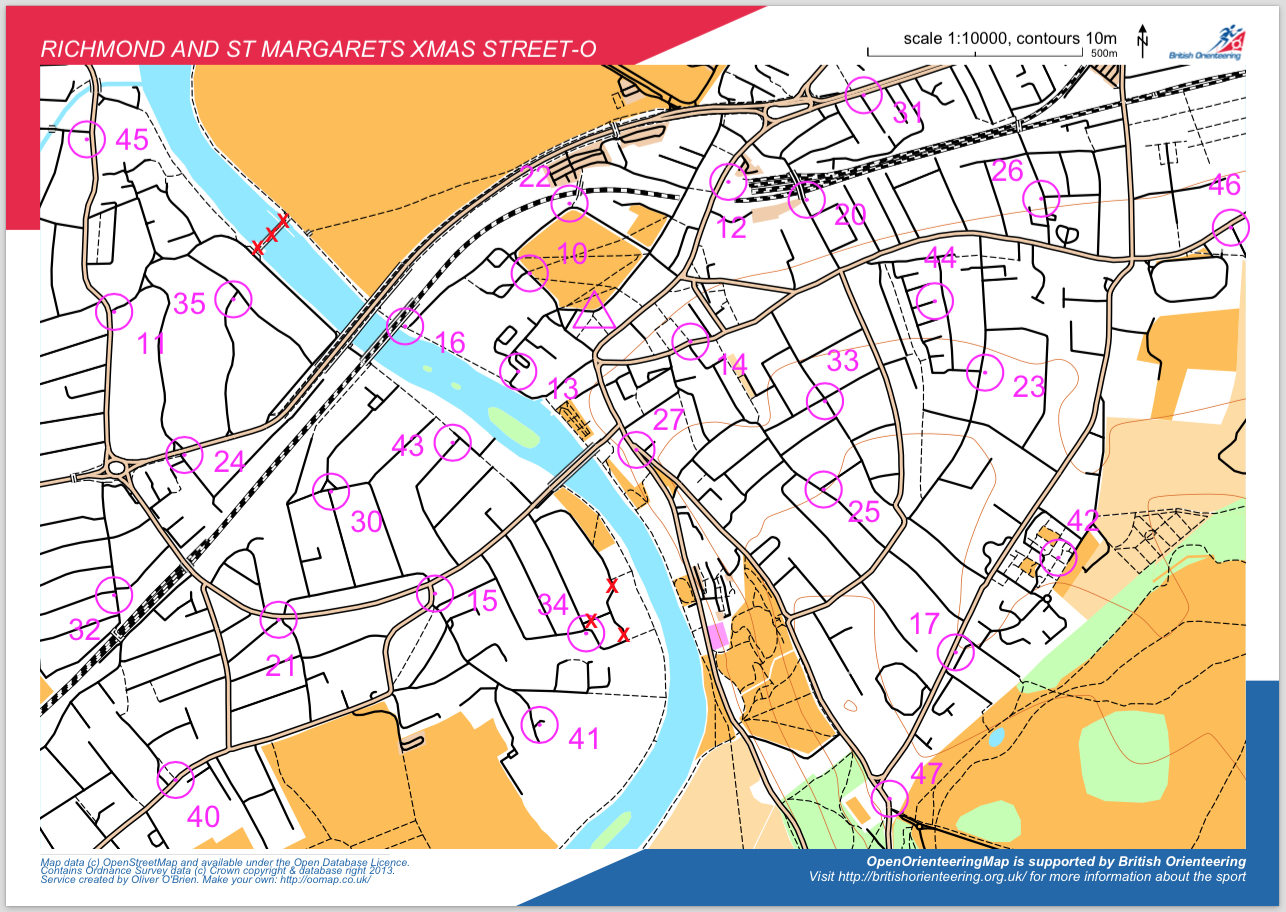
rihcmondstreeto

Above is the map that is being used for the next South London Orienteers’ Street-O event, in December 2014, with around 100 people taking part. Further details of the events can be found at http://slow.org.uk/about/streeto/. Map data Copyright OpenStreetMap contributors.

3. What are the unique needs of a map designed for orienteering? How has using OSM to meet those needs worked out?

Orienteering maps need to be highly detailed, clear and accurate, as competitors run through unfamiliar terrain at speed and the accuracy of navigation is as important as speed, when it comes to getting a good result. This general principle applies to Street-O events, where it is important that all navigable roads, tracks and paths are included and that the map is as uncluttered as possible. Other datasets can often neglect tracks and paths in particular, but OpenStreetMap has historically had a good record in this regard, being a grassroots community comprised of many enthusiastic walkers and cyclists, amongst others. The data isn’t perfect, but for areas in London that my local club users, it’s worked out pretty well. Sometimes missing detail is spotted by the organiser and they edit OpenStreetMap to fix it. Occasionally it isn’t spotted and competitors report back missing paths at the race finish – edits can then be made which will benefit future races there. Both these processes improve OpenStreetMap itself (for everyone) while also improving OpenOrienteeringMap (for racers), so everyone benefits.

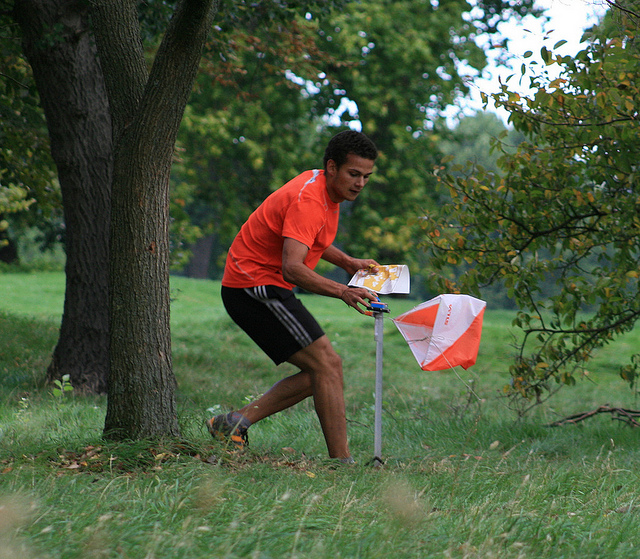
6160108706_c4363f55bf_z
Competitor in a London park. Although he is using a custom drawn map for this particular race, the level of detail in some London parks on OpenStreetMap means that OpenOrienteeringMap is a possibility for more informal events here. Copyright Oliver O’Brien.

4. What steps could the global OpenStreetMap community take to help support the use of OSM in unique communities like this?

One feature which would be of great use, would be the ability to “sign off” certain areas has achieving a particular level of completeness, e.g. a local contributor confirming that, to their knowledge, an area in a particular bounding box has all the roads and paths on it. Such a mechanism was created by ITOWorld with their OSM Quality tool, for Great Britain, using complementary data from the national mapping agency, however a global version, using experienced OpenStreetMap editors as the authority, would very useful in encouraging Street-O event organisers to use OpenOrienteeringMap or other tools for using the data in orienteering events.

5. OSM recently celebrated its 10th birthday, where do you think the project will be in 10 years time?

It will be a map with virtually every building and road in the world on it. Improving and more accessible satellite and imagery will greatly help with this process. Detail will increase too, but I don’t think it will end up mapping every tree or lamppost – there will be spinoff projects which will cover things like that. The project’s licence does ensure that the data will always be as good as it is currently and so can only get better still. I think also, the project emphasis will shift away from the standard “openstreetmap.org” front page map and become more known as the definitive map data store for the world, with other websites becoming the primary way the data is viewed. The project is sometimes described as the “Wikipedia of mapping” and I think it will encounter the same problems, and come up with the same solutions, that Wikipedia did – such as dealing with vandalism of the dataset by having different levels of editors, area guardians and protected places. More generally, I see many more projects like OpenOrienteeringMap filling particular niches and the parent database continues to expand. Perhaps the database will form the start of a global postcode system?

Many thanks Ollie! A great example of a practical application of open geo data. Anyone who is interested in the project can learn more here. OpenOrienteeringMap is just one of many geo related projects Ollie is involve in, I highly recommend everyone follow him on twitter and read his blog.

Categories
Data Graphics London

All the Tweets

Cross-posted from Mapping London, edited slightly.

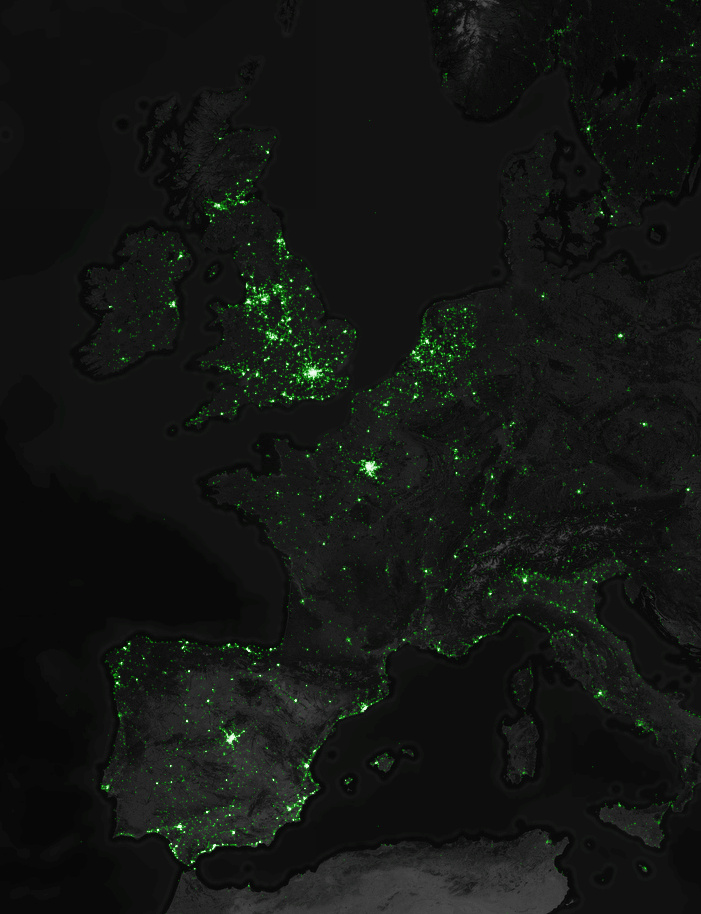
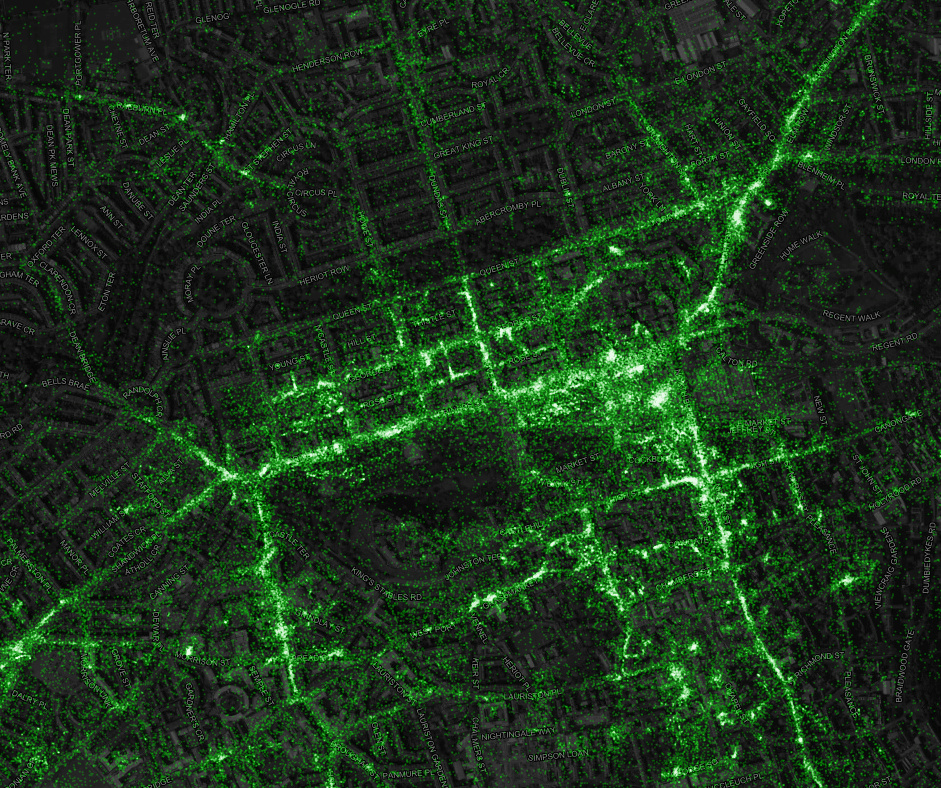
This is a map of geolocated Tweets for the whole world – I’ve zoomed into London here. The map was created by Eric Fischer of Mapbox, who collected the tweets over several years. The place where each tweet is posted from is shown by a green dot. There are millions and millions of tweets on the global map – in fact, over 6.3 billion. The map is zoomable and the volume of tweets means that popular locations stand out even at a high zoom level. The dots are in fact vectors, so retain their clarity when you zoom right in. The map is interactive – pan around to explore it.

If you think this looks familiar, you’d be right. Mapping London has featured this kind of social media ‘dot-density mapping’ a few times before, including with Foursquare and Flickr (also Eric’s work), as well as colouring by language. The key difference with this latest map is the sheer volume of data. By collecting data on geolocated tweets over the course of several years, globally, Eric has assembled the most comprehensive map yet. He has also taken time to ensure the map looks good at multiple zoom levels, by varying the dot size and dot density. He’s also eliminated multiple tweets that happen at the exact same location, and reduced some of the artefacts and data quality issues (e.g. straight lines of constant latitude or longitude) to produce perhaps the cleanest Twitter dot-density map yet. Zooming out makes the map appear somewhat similar to the classic night-time satellite photos of the world, with the cities glowing brightly – here, London, Paris and Madrid are prominent:

activity_westeurope

However it should still be borne in mind that while maps of tweets bear some relationship to a regular population density map at small scales, at large scales they will show a bias towards places where Twitter users (who may be more likely to be affluent and younger than the general population) live, work and socialise. The popularity of the social network also varies considerably on a country-by-country basis. Some countries will block Twitter usage altogether. And in other countries, the use of geolocated tweets is much less popular, either due to popularity of applications that do not record location by default or a greater cultural awareness of privacy issues relating to revealing your location when you tweet.

activity_edinburgh

Above: Twitter activity in central Edinburgh, proving once and for all that the East End is a cooler place than the West End.

From the Mapbox blog. Found via Twitter, appropriately. Some of the background data is © OpenStreetMap contributors, and the map design and technology is © Mapbox.

Categories
London

Book Review: London Buildings – An Architectural Tour

londonbuildings

This book, which features great examples of London building architecture, is itself distinctively designed and immaculately presented. It’s been out for a couple of years now, however I was recommended it when purchasing another book recently on Amazon, as an impulse purchase, it’s an excellent find.

The book was authored by Hannah Dipper and Robin Farquhar of People will always need plates and is based on their heavily stylised interpretation of the buildings featured.

Each building featured in the book – there are around 45 – gets a two page spread, always in the same format – the building shown in white with clean strokes of detail in black, and a distinctive, single tone of colour for the sky. A small inset box includes the buliding name, architects, age and 100 words. That’s it.

The book doesn’t just feature the modern Brutalist London landscape (e.g. Trellick Tower), and the latest modern skyscrapers (e.g. the Gherkin) it also includes such older gems as Butler’s Wharf and the Dulwich Picture Gallery. These two are treated to the wonderful, minimalistic sketch style, with just the two colours allowing the design detail of the building itself to take centre stage.

On Amazon: London Buildings: An Architectural Tour, currently for £9.99. Published by Batsford, an imprint of Anova Books.

Image from the London Design Guide website.

Categories
London OpenStreetMap

OpenStreetMappers of London

IMG_1370

I contributed a number of graphics to LONDON: The Information Capital, a book co-written by Dr James Cheshire, also of UCL Geography. Two of my graphics that made it into the book were based on data from OpenStreetMap, a huge dataset of spatial data throughout the world. One of the graphics, featured in this post, forms one of the chapter intro pages, and colours all the roads, streets and paths in the Greater London Authority area (around 160,000 “ways” which are discrete sections of road/path) according to the person who most recently updated them. Over 1500 indivdual users helped create and refine the map, and all are featured here. I was pleased to discover I was the 21st most prolific, with 1695 ways most recently modified by myself at the time that the graphic was produced.

The more active users will typically have areas around home and work which they intensively map, plus other, smaller areas such as contributions made during a mapping party or other social event organised by/for the London OSM community. Here’s an example filtering for just one user:

osm_dan

Putting the users together reveals a patchwork of key authors and more minor contributors, together forming a comprehensive map of the city. Detail levels vary, partly as the fabric of the city varies from area to area, but also as some contributors will be careful to map every path and alleyway, while others will concentrate on the driveable road network.

osm_detail

The data was obtained from a local copy of the OpenStreetMap database, for Great Britain, that I maintain for various pieces of work including OpenOrienteeringMap. You can obtain the data files from GeoFabrik (this link is to their new London-only version). The data was captured in early February 2014. Newham borough in east London (light blue) shows up particularly prominently because it looks like it had had a bulk update of all roads there by a single user, just before the capture, to indicate which were lit by streetlights (lit=yes).

I used QGIS to assemble the data and applied the temp-c colour ramp, classifying across all the contributors – I then changed the ones which were assigned a white colour, to green. The colours used in the book are slightly different as some additional editing took place after I handed the graphic over. The colour ramp is relatively coarse, so multiple users will have the same colour assigned to them. The very long tail of OSM contributions (where only a small number of people make the great majority of edits) mean that this still means that most major contributors have a unique colour assigned to them.

osm_book


View larger version.

Download:

Note that these files actually are for an area that is slightly larger than the Greater London Authority extent – a buffer from Ordnance Survey Open Data Boundary-Line is used to mask out the non-GLA areas.

If you like this thing, it’s worth noting that Eric Fischer independently produced a similar graphic last year, for the whole world. (Interactive version).