Categories
Orienteering

OpenOrienteeringMap and MapRunF

OpenOrienteeringMap, a website for creating a PDF street orienteering map of anywhere in the world based on OpenStreetMap data, has seen a massive upsurge of use since various countries starting locking down their populations during the Covid-19 crisis. Suddenly, many people have found their exercise limited to around their home area, and, if they aren’t lucky enough to live on a “proper” orienteering map, OOM is a great way of getting a simple map quickly – with blue plaques and (for the UK) postboxes pulled in with a single click as potential control sites.

At the same time, there have been a number of initiatives to combine the basic orienteering concept of navigating with a map between points, with the use of GPS receivers on the smartphones most of us carry, and their increasingly high-resolution screens, to virtually “punch” a control by being in the correct location, and carrying the map on the phone.

MapRunF is one such project – with an Android and iPhone app. Courses can be created on the phone itself using Google Maps aerial imagery, or .ocd format maps and courses loaded in from OCAD or Mapper. But if you want the authentic orienteering experience without needing to do “proper” mapping, OpenOrienteeringMap now offers two buttons to easy the import into MapRunF.

Once you’ve saved your map and course, you can click on the KMZ and KML buttons to download a map and courses file respectably. You can then upload these to Check Sites, note down the ID number, and load it into your phone running MapRun F. Straight away, you have your orienteering map and courses, ready to run!

The KMZ map file does not include the courses or start/finish marker, as these are contained within the KML course file. However, it does contain any crossing point “bridge” symbols or do-not-cross “X” markers that you added.

The KMZ and KML files also work in Google Earth:

Try OpenOrienteeringMap – the UK and Ireland editions update daily from OpenStreetMap, while the Global edition updates once or twice a year – but you can create a map at any time! Look out also for a daily updating Australia version soon.

Categories
Bike Share

How Bikeshare is Reacting to the Covid-19 Pandemic

The recent launch of the UK Shared Micromobility Dashboard has allowed for a closer look at the live situation of bikeshare systems in the UK and how usage and availability has changed in relation to the Covid-19 pandemic. To help with this I have added a column comparing the % of bicycles in the fleet compared with the 2020 maximum.

It is also interesting to contrast how different cities’ bikeshare systems have reacted world-wide, with varying national lockdown policies and different user types have resulted in, in some cases, big increases in usages and, elsewhere, a collapse of usage leading in some cases, unviability.

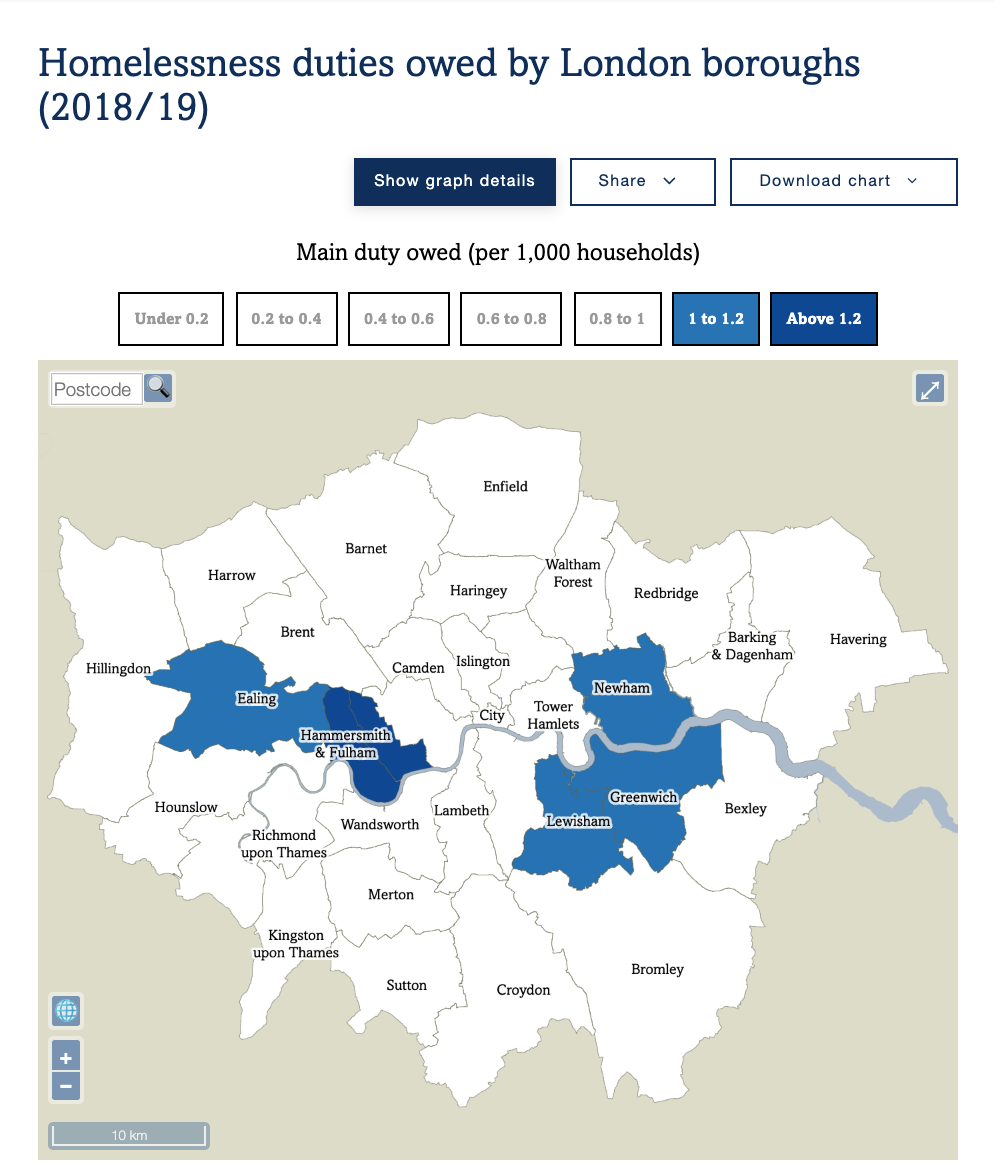
Bikeshare in Lockdown London

London has 11000 bicycles available for automated hire – down a bit from a maximum of 16000 but still a considerable resource.

In summary: 3 of the 10 systems are operating with normal numbers, 3 have closed completely, and 4 have slashed their fleet to under half their size earlier in the year.

The Santander Cycles docked system is just as large as ever – indeed it normally sees a drop in fleet size as summer approaches, down from ~9500 to ~8500 due to maintenance backlogs and/or optimising fleet distribution, but has instead increased to over 10000 – just short of its record. It has also been seeing very high usage numbers – the good weather is helping, but maybe here it is seen as a safer form of transport for a city where most households in the inner city don’t own a car, bike ownership remains relatively low, and bus, metro and train use is being heavily discouraged.

On the other hand, the two systems in London which have steadfastly failed to release live open data feeds about their fleet locations and availability, namely Lime and Bird (London’s only escootershare) quickly shut down near the start of the lockdown. Both businesses have been struggling in general and have shut down in almost all regions globally.

Jump, on the other hand, has remained operating in London – it has shut down in almost every other city it operates in. The London fleet has reduced however to just 20% of its 2020 maximum. The remaining few bikes are consequently being very heavily used. Mobike, similarly, is still operating but down to just 11% of its numbers earlier in the year.

London’s smaller fleets have also reduced in size – Freebike down to 40% of its fleet and operating in a reduced area, and Beryl’s already small fleet down to 26% – Beryl has however launched much larger systems recently in Watford and Norwich, so may be using some of these bikes there.

Finally, the nextbike system in Brunel University and Uxbridge is still running, in contrast to the tiny Kingston University system that has shutdown (which is fair enough, the university itself being almost shut down and university students being the target user). Barnet council’s private system is also still going.

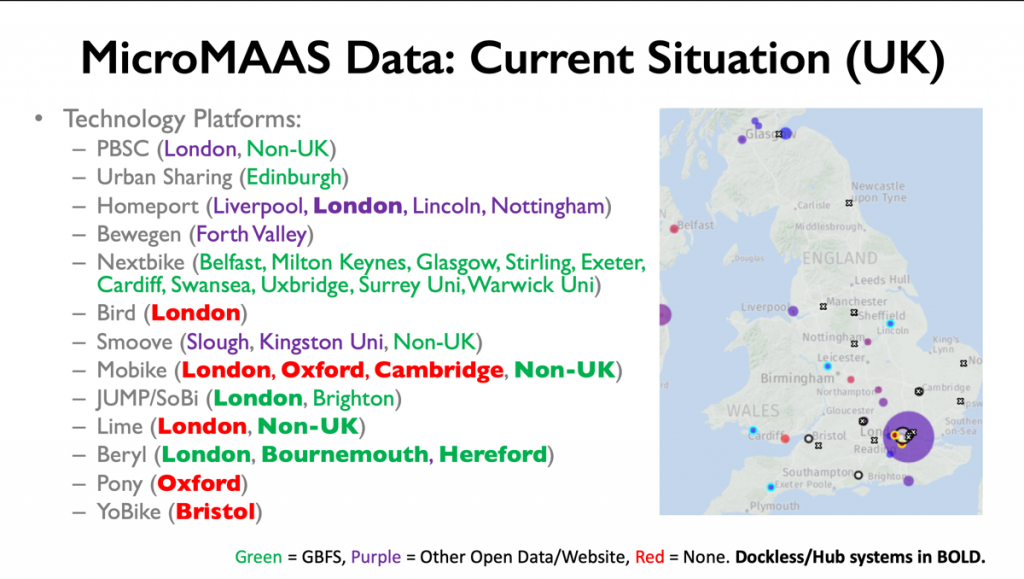
How Bikeshare is Adapting in the rest of the UK

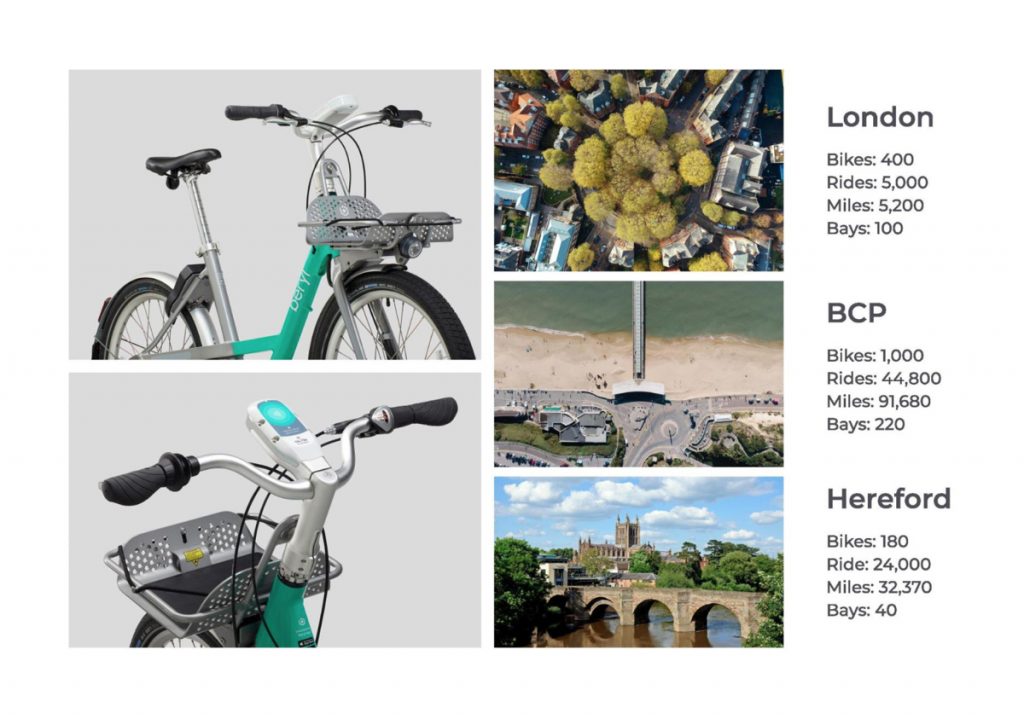
Beryl’s 4 systems in Watford, Norwich, Hereford and Bournemouth are all operating normally. SoBi in Brighton is also seeing normal fleet numbers. Nextbike is more mixed – Cardiff, Stirling, Warwick University and Surrey University are normal, but Belfast, Milton Keynes and Swansea University have closed, and Glasgow is running at half-size, and Exeter is only at 26% of its maximum.

Edinburgh’s Your Bike system is also halved.

Other casualties include Bristol YoBike, the Lime bikes in Milton Keynes, along with Lincoln and Slough, and Oxford and Cambridge Mobike fleets are virtually gone.

Beryl were brave enough to actually launch a new system, in Norwich. It is now the fourth largest system outside of London, due to Edinburgh and Glasgow’s reductions.

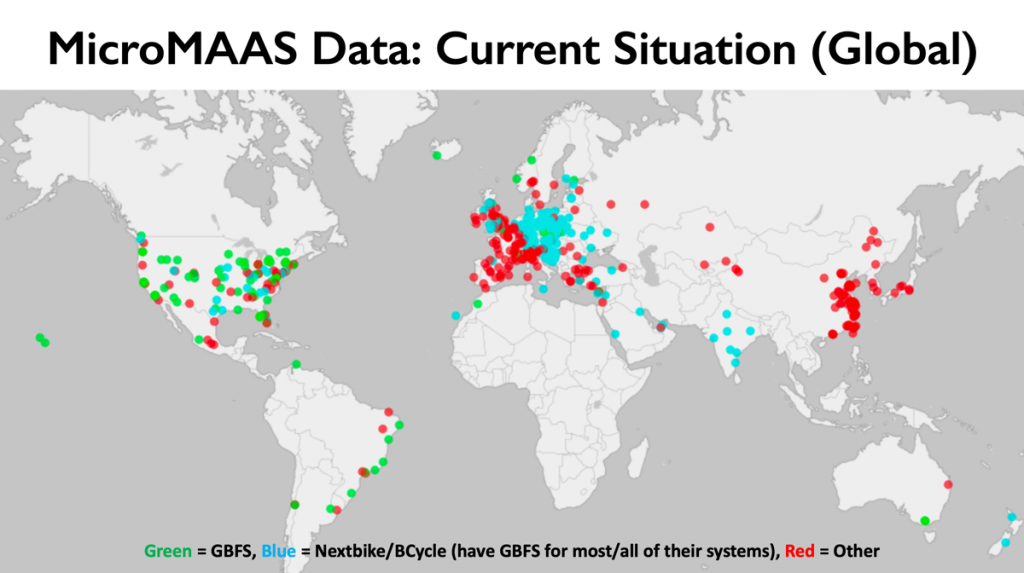
Bikeshare Globally in a Covid-19-afflicted World

Some cities are seeing big increases, some are seeing big decreases. This is likely due to different operator policies, system viability, transport alternatives and user profiles:

  • Some operators have chosen to reduce fleets substantially so that they can continue to operate with reduced staff or to take into account increased cleaning/disinfecting regimes.
  • Financial considerations mean that systems which were losing money and not strongly tied to a public operations agreement will take this as an opportunity to shut up shop and take a breather, maybe to restructure the business.
  • Where bikeshare competes with public transit, and the latter’s service is reduced or actively avoided by people social distancing, bikeshare is likely to grow. Conversely, if the private car was the alternative, bikeshare has a weaker case for being a “safer” alternative.
  • Tourist-dominated systems will have seen huge drops as there are many few tourists. Utility-dominated systems will however see much less of a drop, as people still need to do the key errands such as shopping or going to work (where allowed). Commuter-denominated systems will see a big drop as there is much less commuting going on. Finally, recreational systems are probably OK as exercise is recognised as an ongoing need in many locked down jurisdictions.
Categories
London OpenLayers

London’s Poverty Profile 2020

Trust for London (TFL), a charity and themselves a major funder of charitable projects in London to address poverty and inequality, has this week launched the London Poverty Profile (LPP) 2020. There is an updated data-driven website with over 100 different indicators of poverty and inequality, compiled by WPI Economics, along with a PDF report snapshotting the indicators as at early 2020.

With the ongoing Covid-19 pandemic and resulting lockdown likely to cause a significant impact on London’s social economics and community wellbeing throughout this year and going forward, the LPP 2020, which was compiled with pre-Covid-19 data, acts as an important baseline, looking at London’s poverty and inequality profile towards the beginning of the year.

As one of the world’s most international and wealthy cities, it is easy to overlook that London also has areas of extreme poverty and deprivation. The luxury apartments of Knightsbridge and Chelsea are often in the headlines but less obvious are the endemic poverty that has persisted in areas such as much of Newham borough in east London, parts of Tower Hamlets close to the glittering lights of Canary Wharf, or even North Kensington in the west. The recent political focus may have been on “rebalancing the North” (of England) away from London as a whole, but treating London as a single unit of the wealthy South is over-simplistic. The London Poverty Profile acts to ensure that all of London is understood and its challenges, when considered at detail, are not overlooked.

The Consumer Data Research Centre (CDRC)’s London hub has been involved with the LPP 2020 and will continue to work with Trust for London going forward. Our role has been two-fold. First of all, I was seconded to Trust for London periodically over the last year to overhaul the mapping system that appears on the LPP webpages. Previously using a heavily simplified representation of London boroughs, it has now been rewritten to use OpenLayers 6 (in Javascript ES6 form) which is integrated with the Content Management System used to publish the data and indicators by WPI and TFL. Secondly, CDRC will be contributing and mapping “experimental” datasets, from time to time. These will utilise CDRC’s own datasets and its ability to cross-tabulate datasets from other source, open and non-open, to provide further innovative insight into spatial aspects of poverty and inequality across the capital’s 9 million population.

Geographies that can now be used extend beyond the London boroughs, to include LSOAs, MSOAs and (shortly) Wards. This allows more detailed maps. Poverty does not stop at London borough boundaries (although there are a number of cases where there is a big change, for example Redbridge to Waltham Forest), and some boroughs, such as Haringey, are well known for having a considerable east-west split, with a major railway line acting as a physical and socioeconomic split between wealthy Highgate and Muswell Hill to the west, and poorer Wood Green and Tottenham to the east.

Sometimes, other political boundaries do show a step-change in deprivation, as seen here between Ilford South and Barking constituencies (which is also a Redbridge/Barking & Dagenham borough boundary):

In addition, the maps use a selection of ColorBrewer colour ramps to ensure that spatial trends in the datasets are easily seen. ColorBrewer is widely used in the digital cartography field to ensure visually fair and effective use of colour in showing quantitative data.

All maps include a postcode search widget, and ones showing data at a final resolution than London boroughs include a toggle between borough outlines and Westminster political constituencies. Maps are zoomable and pannable, and PDFs and images can be quickly produced.

For launch, the new maps on London Poverty Profile include:

In addition, a number of existing maps on the LPP have been brought over to the new system, and other datasets, typically those split by borough and with some slight of spatial autocorrelation, will also gain maps in due course.

We hope to introduce additional experimental datasets, and corresponding maps, to the London Poverty Profile, on an approximately monthly basis this summer. Possible examples, based on current maps on CDRC Maps, include mapping on access to broadband, rate of household composition turnover, and consumer vulnerability to marketing practises.

Understanding the spatial characteristics of London’s poverty, inequality and other social challenges, is vital, and our hope is that these maps will help inform and better navigate the data available.

Categories
Bike Share

Edinburgh Launching Pedelec Bikes on 2 March

Edinburgh’s Just Eat Cycles is launching pedelec (electric) bikes into its fleet on 2 March. The bikes will make up approximately 1/3rd of the fleet and will be dockable at any of the existing docking stations. Fees are 10p/minute, on top of the existing £1.50 hire charge for the regular bikes. Subscribers pay the minutely fee too but, as with the manual bikes, there is no hire charge).

More details at https://medium.com/@justeatcycles/edinburghs-rentable-e-bikes-to-be-available-from-2-march-and-cost-10p-per-minute-c4cefcdab6a5

Congratulations to Edinburgh for beating London’ Santander Cycles (which has the same operators and similar bikes). Edinburgh joins Glasgow, London’s Jump, Lime and Freebike systems, Milton Keynes’ Lime, Brighton and Exeter, in having part or all electric fleets.

Categories
Escooters

EScooter Regulations On Their Way in UK?

An intriguing article from the Times (£), suggesting that eScooters, which are illegal to ride on public land in the UK, but are nonetheless quite widely used in the London commute and elsewhere, could be legalised and regulated, with them being coming under the same regulations as pedelecs – specifically, they can be used in places that bicycles can, as long as their maximum speed is 25km/h (15.5mph). A government consultation on these changes may be on the way soon, followed by urban trials and then possible legislation.

A small scale trial has been running in London’s Olympic Park, by Bird, using technically private land there that is part of the post-Olympic space.

This has the potential to open up the UK to the kind of fierce eScootershare competition seen in many Western cities outside the UK. However, by the time eScootershare gets here, the mode may have cooled off elsewhere -the industry is now moving into a period of consolidation, as investor money burns through and profits are elusive – particularly due to the short “shelf life” of the devices, on the mean streets of Paris, Washington DC and elsewhere.

Scooters, of course, aren’t “active transport” – the exercise benefits for the user are less – particularly as they can be used literately door to door – but they are certainly healthier for other cyclists and pedestrians, than the equivalent, car, taxi or bus usage.

Categories
London

Camley Street Future Development

The Camden High Line makes a small appearance in the Camley Street Neighbourhood Plan published by Camden Council in July 2019. The eastern entrance to the High Line is on the northern end of Camley Street itself:

The Camden High Line was suggested by blogger Oliver O’Brien in 2015 and is being actively pursued by the Camden Town Unlimited BID. The aim is to create a linear, green and open walkway between King’s Cross and Camden Town. The route would utilise a disused railway line that runs alongside the existing Overground route. O’Brien identified a route whose eastern end terminated at Camley Street, using the existing stairs towards the northern end of Camley Street on the north side of the railway.

A revitalised Camley Street, combined with the High Line, would make for a scenic walking route between Camden Town and King’s Cross Central, or, combined with the canal link, an interesting triangular walk.

The Camley Street Plan also shows it on one of its maps:

Categories
Bike Share Conferences

Walking & Cycling Innovations

I was invited by organiser Landor LINKS to speak at the Walking and Cycling Conference which took place in Manchester last month. The conference included a good focus on bikeshare, and it was a good time for the UK-focused bikeshare industry to pause and take stock of a busy 2019. Three UK-focused bikeshare operators – Freebike, Beryl and Nextbike UK – were present, and it was good to chat with the respective teams and find out how the year had gone and their thoughts for the following year.

MicroMAAS and the UK

I presented on “MicroMAAS” data – first defining MicroMAAS as mobility share services that you can pick up (i.e. bikeshare and escootershare) and outlining the different types of bikeshare popularly available:

I then talked about the “why” of open/standardised data in the sector:

and the “where” – Europe is well behind the US here:

I mentioned CDRC’s excellent and huge collection of largely dock-based bikeshare dock data, available through the CDRC Data Service:

The last part of my talk touched on managing such systems, including key players in analytics platforms:

I also outlined and bemoaned and the (little) progress towards fourth generation bikeshare systems where payment is fully integrated into how other transport modes are paid for, rather than being app-siloed. Right now we are in a commercial battle, with providers looking to integrate vertically rather than horizontally – largely due to the weak management of the sector by local authorities here in the UK – who seem happy to take money and less happy to regulate the sector properly and effectively so that MicroMAAS will actually be a net benefit to the wider UK streetscene:

Beryl Update

Of the other talks, I was particularly interested in Beryl’s – especially they included some data on their first half-year of operations. UK bikeshare usage data is still rather sparse so it was good to see these numbers in a public presentation. The London operation is very small – they quickly moved out of Enfield after the system was heavily abused and little used there – and the City of London “square mile” only has limited need for journeys within it:

Slide © Beryl Bikes (from their presentation)

London’s on-street available fleet is typically around 144 (and around 100 currently) rather than the 400 mentioned here. With approx 5 months between launch in July and the early December presentation, this suggests around 30 rides a day or just 0.2 rides/bike/day (as a rule of thumb, for a non-electric system, over 1 is just about OK, over 2 is good and over 3 is really good – for electric you need 2+ due to the extra costs of the bikes and retrieving them to charge). As you can’t really do a point-to-point journey in the City that is longer than a mile and a bit, this would explain the average journey being just over a mile – half that of Bournemouth.

This may improve with their extension to Hackney that is happening now – so far they have moved into Shoreditch and Hoxton in the south of the borough, but in time if they move into parts unserved by Santander Cycles then they become the cheap, manual alternative to Uber’s JUMP here.

However their numbers for Bournemouth and Hereford – the latter helped by a generous public subsidy – are much more positive. Bournemouth launched in mid-June and averages around 300 bikes (although 140 bikes currently) – so 1 t/b/d, and Hereford launched at the end of July, averaging around 160, or 1.3 t/b/d. Bournemouth is suffering from theft though.

JUMP

I’m also hearing good numbers coming out of Uber’s JUMP system in London – so it is possible for commercially-led bikeshare systems to work here in the UK, it just takes a lot of experimentation, effort and investment.

See also Bikesharp, which is my blog exclusively dedicated to the minutiae of the UK bikeshare market.

Categories
Bike Share

Multimodal MAAS – Still a Long Journey

An interesting article posted by Bloomberg recently highlights the challenges and commercial pressures, and public/private conflicts which are going to make bikeshare and other micromobility services a challenge to integrate into a multi-mode, multi-operator journey experience for the major-city commuter. Transport for London (TfL) recently turned down an approach from Lyft, who operate various bikeshares, rideshares and cab hires in North America but not Europe, to integrate the transactional (i.e. booking/paying) element of the Santander Cycles (owned and specified by TfL) into their own multi-modal journey planner. So, a user would no longer need to carry around a multitude of apps on their smartphone, one for each leg of the journey.

It is understandable that TfL would want to keep exclusivity on the transaction layer for their well-used and almost-profitable bikeshare system in London, but there is a big conflict – TfL is publicly funded and is acting as both the regulator (for various commercially-funded dockless/hub-based bikeshare systems) and funder/specifier (for its own bikeshare system). While TfL is presumably at pains to keep its “Chinese wall” separation between the regulatory and service-provider wings of its new mobility offerings in London, it is in practice finding this hard to do, as this case illustrates. TfL would find it hard for one side to mandate the other side to loosen control on the parts of its operations that could result it in making slightly less money – even if it would result in a much improved experience for the user.

It’s not just public bodies that are struggling with the provider/regulator split. Commercial providers, like Uber, are now making serious pushes to be the one-stop shop for people wanting to travel around cities like London, be it on their own cab service or bike fleet, or by public transport. Of course, their apps will only show services that are not directly competing with their own – so only Uber cabs and JUMP bicycles (not any of the other 8+ bikeshare providers in London) but including the tube and railways, as these are a less direct competitor and cabs/bikes can plug gaps in the way railways can’t. Their hope presumably is that if commuters start to seriously use the Uber app to check train running information, the app will be heavily suggesting a cab or bike as a more appealing alternative. Google Maps has been doing this for a long time – it has long been good on public transport, and was, for a time, making Santander Cycles docking stations obvious – now these are all but hidden by Lime bikeshare bike locations.

Unfortunately these kinds of solutions tend to be all take and no give – Uber won’t release its bike or cab locations to anyone else for free, but happily takes the open data feeds on where the tubes are and how they are running. Here, the lack of transactional capability for the public transport section is not such an issue – as users can just tap cards on barriers rather than having to buy a (virtual) ticket in another app. But it’s still an asymmetric travel opportunity. The only real solution is to mandate that all providers of MAAS have to open their live availability data. They are good at doing this in the US – sometimes too good, as companies shut down more quickly than planned as their data shows little profitable use – but it does mean that more innovation is happening there. The transactional leap hasn’t happened however, even where all operators show their assets through open data standards like GBFS or MDS. A true multi-modal, multi-operator app needs to handle the transactional (i.e. financial) part of each leg as well as the availability/discovery piece. While we are in a controlled free-for-all, with little public money contributing, the commercial operators will continue to fight with each other and keep things as siloed as possible – to the detriment of the commuter, the city, and pavement space.

Categories
Bike Share

Free JUMP and Beryl Trips Today – but JUMP Increases Fees

JUMP has a promotion in London today. To tie in with general election day, JUMP are offering two free rides. It is being promoted as an easy free way to (and back from) your polling booth, although I would have thought most polling booths in London would be walking distance. Anyway, you don’t have to use the code to just go to vote, you can in fact use it for any two journeys in London’s operating area, today. The promotion includes two £1 unlock fees, and up to 24 minutes of usage across one or two trips. It’s worth up to £5 in total. (JUMP is 12p/min with no free period after unlocking).

The promotion runs until 11pm tonight only and use code ELECTIONDAY19ED to activate it, on the JUMP section of the Uber app. Out-of-operating-area and banned parking area fines still apply.

Beryl, who operate a small system in the City of London and larger systems in Bournemouth/Poole and Hereford, also have a free-today election themed promotion. No code is needed, and the free period is half an hour for each of two journeys – however you must remember, as always, to finish your journey in a marked hub. The promotion finishes at midnight.

JUMP has increased its charges recently – it used to offer a 5 minute free period after the £1 unlock, but now the 12p/min charge starts from the moment of hire – so most journeys now cost 60p more.

JUMP’s 1300-strong fleet operates in Islington, Camden and Kensington & Chelsea boroughs, along with a small part of south-west Haringey. They are due to move back into Hackney soon. The position of red zones in the app suggests an aspiration to launch in Tower Hamlets soon along with inner south London.

Categories
Bike Share

Beryl Expanding into Watford and NYC

East-London startup Beryl continues to expand their bikesharing footprint – their existing hub-based operations in the City of London, Hereford and Bournemouth/Poole are being joined by a 200-300 bike system in Watford next spring. Of note, this will include 100 electric bikes – a first for Beryl.

Mixed-type systems are fairly rare due to their operational complexity for both users and operators, however both London’s Santander Cycles and Edinburgh’s Just Eat Cycles are also going to part-introduce electric bikes to their fleet. Glasgow already has such a system, but the limited numbers of electrified docks cause confusion and fines for their users.

Beryl are also expanding internationally, launching an up-to-1000-bike system in Staten Island, one of New York City’s five boroughs and not currently served by the 14000 dock-based bikeshare bikes in Manhatten, Brooklyn and Queens. Staten Island has recently withdrawn the permits for Lime and JUMP, who were operating dockless systems in the borough. Beryl’s system here will presumably also be electric, due to Staten Island’s notoriously hilly topography.

Beryl was due to expand in London to Barnet, however they recently withdrew from neighbouring Enfield due to vandalism, so they may have decided that outer-London surburbia’s low density and limited existing cycling infrastructure and opportunity is not for them.

Beryl is also expanding their London footprint to Hackney, and launching in Norwich, soon.