I recently headed down the Lea Valley for a short visit to Stratford City (thanks to their Sundays-until-6pm policy when most other large retail areas close at 5pm) and spotted a few changes, + a couple I saw from another recent cycle down the Lee Navigation towpath and one extra one I spotted from reading a newspaper article just now:
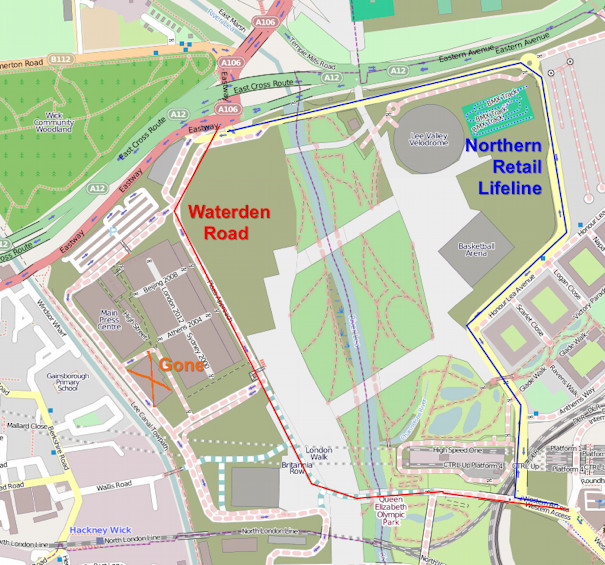
- Bicycles (but not pedestrians – no pavements) can finally use the Northern Retail Lifeline. Or, at least, I got through on my bike. It might have been because the people at the security box that had always blocked me previously had gone home at that time on a Sunday evening though. The Northern Retail Lifeline is the wiggly link road going from the A12 to Stratford City. This is its official name – it appears on a roadsign at its northern end. Its windy course through the Olympic Park means you get a nice close-up view of a lot of the post-Olympic redevelopment.
- Apparently Waterden Way, a more direct access from the north than the Northern Retail Lifeline, will open in May and will include fully segregated bike lanes. Hopefully these will be better than the laughable pavement/cobbled bike lanes surrounding Stratford City as it stands. That is, at road level, straight, and with a step up/down barrier to the traffic. We shall see.
- The Velodrome is looking really good as ever.
- The area where the Riverbank Arena was (for hockey) is extremly churned up, looking almost apocalyptic.
- The shell of the Basketball Arena remains, but is disappearing quite quickly. Same at the Waterpolo Arena.
- Most of the seating wings for the Aquatic Centre remain.
- The Village Operational Support Area in Leyton has completely disappeared, fence and all.
- Most of the rest of the security fence around the Olympic Park remains, including the electric fencing, CCTV and microwave detectors. I understood why it was that extreme before/during the Olympics, and appreciate that the (de)construction needs a decent barrier, but the continuing overbearing nature of it is pretty horrible. They could have least removed the top (electric) bit by now.
- The Media Catering Village has also disappeared. I know this doesn’t sound that exciting, but it was a pretty substantial three-story building that I spent up to an hour in during every Gamesmaker shift. Incidentally, like many London 2012 things, it was massively over-specced, I never saw the Gamesmaker area more than 30% full and the press dining areas were never more than 10% full. The MacDonalds underneath was packed though.
- The two new pedestrian bridges across the Lee Canal are still looking very unconnected.
- Temple Mills Lane is still looking extremely firmly closed, the gate at the eastern end at least shows no sign of opening anytime soon. I had previous thought it might open this spring.
- I spotted my first signpost pointing to the “Queen Elizabeth Olympic Park”. It was a cyclists’ signpost and was in Highbury (!).
- Stratford City is very busy at 5:45pm on a Sunday evening.
A few other related bits and pieces:
- I didn’t get in the ballot for Ride London 100, which will start in the Olympic Park this summer.
- Here’s a site dedicated to reporting what happens in the Olympic Park now. Good stuff.
- Hackney Council want to hold large scale events on Hackney Marshes every summer, following the Hackney Weekend event last June. Personally I can’t think of anything worse. Pretty much the whole marsh was sealed off for a month before, and a couple of weeks after, meaning that my local parkrun event had to be cancelled during that time. I would be more supportive if the setup/takedown process was done in a week or so, but six weeks is just ridiculous. There’s a perfectly good venue being created, less than a mile to the south-east of Hackney Marshes…
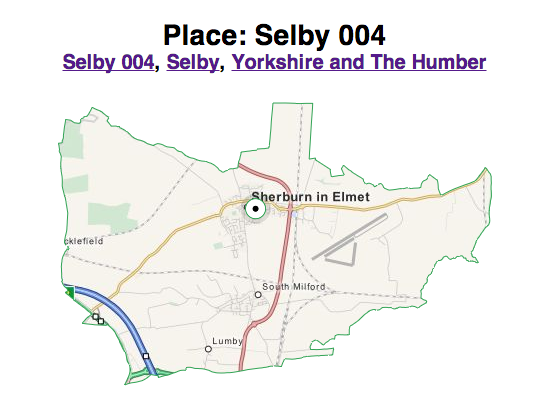
Basemap (c) OpenStreetMap contributors.