Categories
London

TubeHacker: 10 Ways to Optimise Travel in London

wtt

1. Tube trains do run to a strict timetable, rather than just “saturating” the tunnels with trains, as can appear to be the case on many lines during the rush hour.

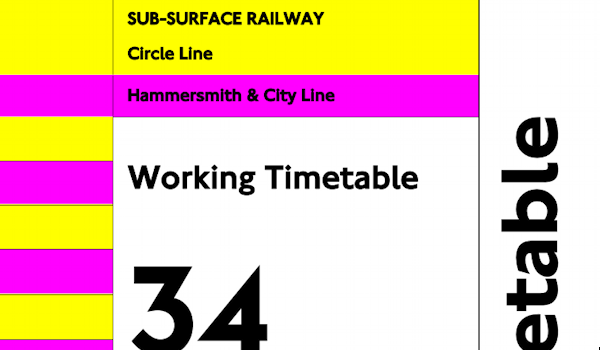
This is not normally useful because the gap between trains is so small, so TfL doesn’t publish the timetables, except for first/last trains and, for train geeks, the Working Timetables are hidden away on their website. However, the timetables (which are accurate to quarter-minutes) are useful near the start or end of the day – particularly around midnight, where the frequencies drop right down. Journey Planners, such as Google Maps, make use of the hidden timetables. Case in point – a recent journey suggested a Circle Line train arriving at 0002 at Paddington, going eastwards. Sure enough, as I ran down the stairs a hundred seconds after midnight, it was just pulling in. For less frequent services, such as Metropolitan Line trains to Amersham, the timetables become event more important. Crossrail will also likely be relatively infrequent, especially for services to the far ends.
tube_osi

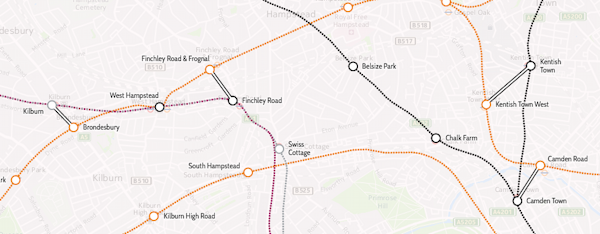
2. Out of Station Interchanges (OSIs) can be useful for saving money (i.e. avoiding Zone 1) or time (as distances can be much smaller between other lines than the tube map can suggest). They are “free” transfers which are not shown on the tube map, but which count as only one journey, even if you go out through ticket barriers and back in at the other station. The system does the maths so you don’t end up paying for too. Each OSI has a time limit between the two sets of barriers, so don’t go shopping in between the stations! You can see the current OSIs between tube/DLR/Overground stations on this map, or see this page for the complete list.

3. You don’t have to flag down, hail or otherwise signal TfL buses. This has been the case for a few years. Bus drivers will always stop if they see you at the stop and you show a vague interest towards the bus – such as facing it and looking at it. Save your weary arms and don’t give passing cyclists frights!
london_bikeshare

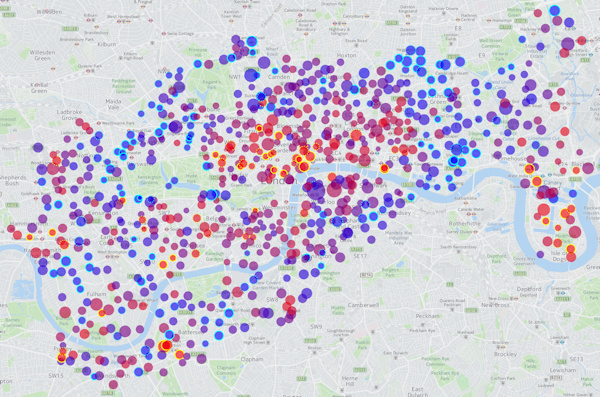
4. The Santander Cycles (a.k.a Boris Bikes, or generically, the London Bicycle Sharing System bikes) stretch across a wide area of central London. They charge £2 for every 30 minutes after the first half hour. You can save money on a long journey by docking just before the 30 minutes is up, waiting at least 5 minutes, and then starting the next leg of the journey, either from the same docking station or a nearby one. (N.B. Santander Bikes are not included in the Oyster/Contactless/travelcard system – yet. They may be included from summer 2017 onwards.)

5. Oyster/Contactless is always cheaper than paper tickets when travelling in Zone 1-6, or on any TfL services outside of these zones, but not necessarily when on non-TfL services travelling outside of Zone 1-6. For example, paper tickets from Gatwick Airport to London Bridge/Blackfriars or to London Victoria can sometimes be cheaper than Oyster/Contactless – particularly at weekends with “Super Off-Peak” paper tickets and especially if you have a railcard that you can’t use with Oyster/Contactless. I can travel from Gatwick to Blackfriars for £5 on Sundays with a buy-on-the-day paper ticket and a Network Railcard, but it’s £8+ with Oyster. N.B. In rare cases, the end-of-day batch calculation that Contactless uses, compared to Oyster with its immediate charging, means that Contactless can work out cheaper than Oyster. Geoff Marshall (Londonist) investigated this.

6. 2-for-1 to top London Attractions: If you have a paper train ticket (i.e. for National Rail and London Overground, not the tube) to the stations nearest the attraction then you can get a 2-for-1 on entry (e.g. Richmond to Kew Gardens for visiting the aforementioned gardens is £3 for 2 people – save £16+ on getting in). You don’t actually have to do the journey though, and you don’t need to buy the tickets from the start of your theoretical journey – buy it at the station nearest the attraction if there’s a ticket office there. Buy a journey which is very short, as then it will be cheap!
tube_shortcuts

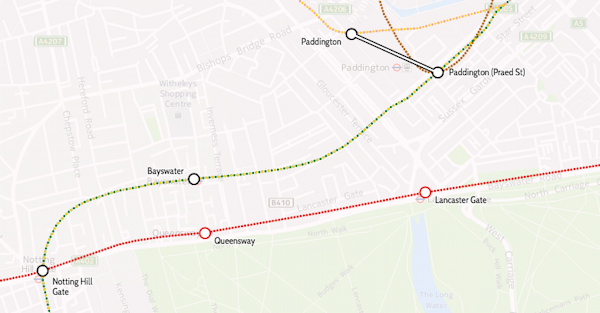
7. The tube map is far from geographical. Here are some journeys that are shorter by walking, than by taking the tube:

  • Leicester Square to Covent Garden (450 people a day do this journey by tube! Don’t!)
  • Bayswater to Queensway
  • Paddington to Lancaster Gate (i.e. Hyde Park)
  • Farringdon to St Paul’s

8. Sometimes, you don’t need to get the tube. A day bus pass is £4.50, but you get a free one automatically put on your Oyster/Contactless after 3 bus journeys that day, and then you can go on unlimited other TfL buses for free until 0430 the following morning. A “Hopper” ticket giving you two journeys in an hour for £1.50, is coming in September. In both cases, you pay for the electronic ticket through Oyster or a contactless credit/debit card – buses don’t take paper tickets.

9. Buses don’t have zones, but are included in any travelcard. So you can have a Zone 1-2 travelcard and then travel out from Zone 2 on a bus, to Zone 3 or right to the edge of London etc, then back into Zone 2 from Zone 3 on a bus, all on the travelcard.
singlefarefinder

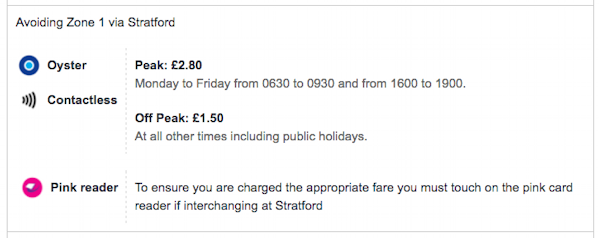
10. If you avoid Zone 1, long journeys can be extremely cheap. For example, stay on TfL rail services (Underground, Overground, TfL Rail, Tramlink) and it’s just £1.50 off-peak, no matter how far you go – you’ll need to touch on pink Oyster card readers when changing trains, to prove you went that way. Uxbridge to Upminster is just £1.50 off-peak with Oyster/contactless, despite being over 31 miles as the crow flies. Just touch the pink reader at Stratford’s Overground platforms. This doesn’t always work – if you have to travel back on yourself then you may not get the discount. For example, Earl’s Court to Highbury and Islington doesn’t work (despite both being in Zone 2), but very close by West Brompton to Highbury and Islington does, because you leave the same direction as you arrive, when changing at West Brompton. The single fare finder is extremely useful as it will always tell you if there’s an avoid Zone 1 option for your journey, and where you may need to touch a pink reader to prove it.

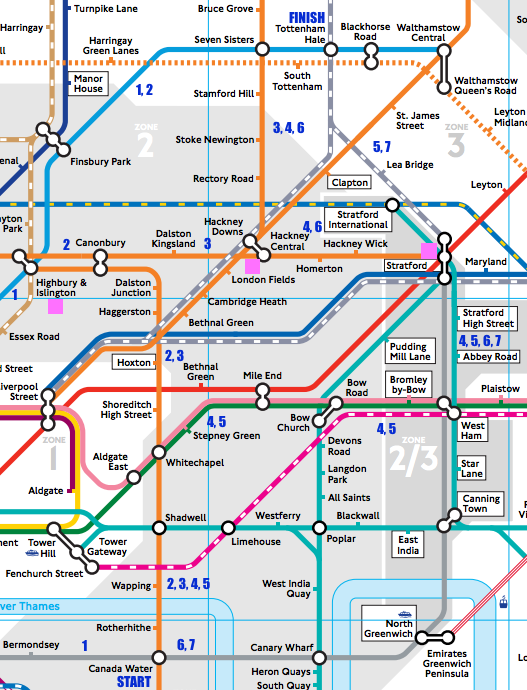
To complicate things even more, there’s certain journeys where touching a pink reader, will *increase* the fare you made – even if you didn’t go into Zone 1. A pink reader acts as proof you were at that place, and TfL will apply rules about logical/sensible journeys, based on this information. For example: Canada Water to Tottenham Hale: Single Fare finder says it’s £1.50 if you end at the National Rail gates there, and £2.80 if you end at the Underground gates.
pinkvalidators

There are, I think, seven sensible off-peak routes, based on Zone 1/not Zone 1 choice, whether you have a bike and that the Stratford-to-Tottenham line being very infrequent – below, I’ve assumed leaving Canada Water as soon as possible after 8pm on a normal Friday and got the times from TfL’s Journey Planner or Google Maps:

Route Change At Zone 1? Bikes allowed? Pink Readers How Long (mins)? Fare
1 Green Park Yes No 33 £2.80
2 Highbury & Islington Yes No 33 £2.80
3 Canonbury, Hackney Central Yes Yes 45 £1.50
3 Canonbury, Hackney Central Yes Yes Hackney Central 45 £2.80
4 Whitechapel, West Ham, Stratford, Hackney Central No Yes £1.50
4 Whitechapel, West Ham, Stratford, Hackney Central No Yes Hackney Central £2.80
4 Whitechapel, West Ham, Stratford, Hackney Central No Yes Stratford £1.50
4 Whitechapel, West Ham, Stratford, Hackney Central No Yes Stratford, Hackney Central £1.50
5 Whitechapel, West Ham, Stratford No Yes £1.50
6 Stratford, Hackney Central No No £1.50
7 Stratford No No 34 £1.50

Cheaper than it should be, Pink validator increases your fare, more expensive than it should be, Pink validator increases your fare, correctly

There are other possible routes, but they are less sensible (i.e. not as fast), such as taking the Overground circle the long way around (via Clapham Junction).

If you go via Canonbury and Hackney Central/Downs (route 3), you pass through Zone 1 (Shoreditch High Street station), however the default off-peak fare is £1.50 as you finish at the National Rail gates. Touching at the interchange between Hackney Central and Hackney Downs will increase the fare to £2.80, because you proved you’ve gone that way, not via another route changing at Stratford only, which does avoid Zone 1. You could go in fact still change at Stratford and Hackney Downs/Central, which avoids Zone 1, but touching at Hackney Downs/Central will charge you the Zone 1 fare. This route is sensible, because the direct Stratford trains are only once every 30 minutes (and often not running at all). An even more convoluted route, changing at Whitechapel, West Ham, Stratford and Hackney Downs/Central, is still viable for me, as if I’m taking a bike on the train, I can’t do the Mile End to Stratford or Canada Water to Canning Town sections…

Categories
BODMAS OpenLayers

The Great British Bike to Work

Cross-posted from the DataShine blog.

cycle_thumbnail

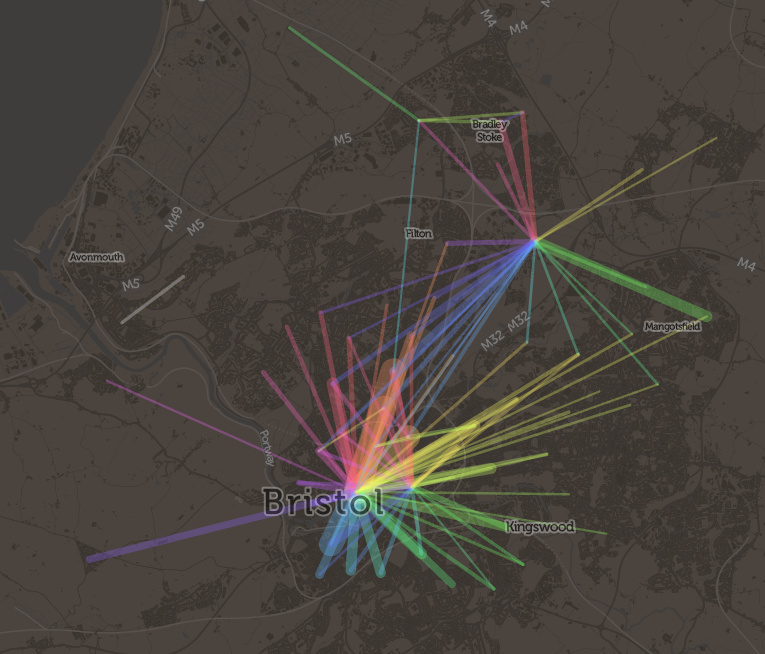
Here’s a little visualisation created with the DataShine platform. It’s the DataShine Commute map, adapted to show online cycle flows, but all of them at once – so you don’t need to click on a location to see the flow lines. I’ve also added colour to show direction. Flows in both directions will “cancel out” the colour, so you’ll see grey.

London sees a characteristic flow into the centre, while other cities, like Oxford, Cambridge, York and Hull, see flows throughout the city. Other cities are notable for their student flows, typically to campus from the nearby town, such as Lancaster and Norwich. The map doesn’t show intra-zone (i.e. short distance) flows, or ones where there are fewer than 25 cyclists (13 in Scotland as the zone populations are half those in England/Wales) going between each origin/destination zone pair – approximately 0.15% of the combined population.

Visit the Great British Bike to Work Map.

Categories
CDRC Geodemographics

A Map of Country of Birth Across the UK

eastse_countryofbirth

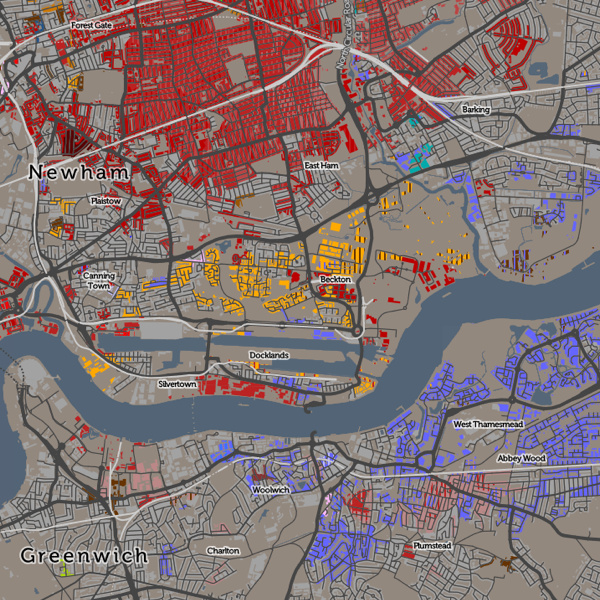
Above: Areas of east and south-east London with more than 8% of inhabitants being originally from (from top to bottom) India (in East Ham), Lithuania (in Beckton) and Nigeria & Nepal (in Abbey Wood).

[Updated] Ever wondered why some branches of Tesco, the ubiquitous supermarket, have an American food section, while others have a Polish food chiller? Alternatively, it might have a catch-all “World Food” aisle, or it might not. The supermarket is, of course, catering to the local community. Immigrants to the UK do not uniformly spread out across the country, but tend to cluster in particular localities.

The latest map that I’ve published on CDRC Maps is a Country of Birth map, which attempts to summarise such communities in one view. It uses the same technique as Top Industry, it maps the most common country of birth (excluding the home nation) of residents in each small area, as of the 2011 Census. The purpose of the map is to identify and map the approximate extent of single-country communities within the UK. For example, to see how big London’s Chinatown is, or whether a Little Italy in the capital still exists.

This map reveals such communities although there is an important caveat when looking at it. I have set out below the rules I applied when constructing it, the most important of which is that only 8% of inhabitants need to share a single country of birth, for it to appear on the map. Bear in mind that, across the UK, 87% of people were born here. These people do not appear on the map, unless they are outside their home nation (and not at all if they are English).

countryofbirth_keyThere are a number of rules I have needed to apply to make this a map that tells an interesting story in a measured and fair way:
  • I don’t map native births – the English-born people in England, Welsh-born in Wales, Northern-Irish born in Northern Ireland or Scottish-born in Scotland. There are almost no areas anywhere in the UK where people born in a single foreign-born country outnumber the native-born. If I did map such native births, then the map would be almost completely dominated by them, and would not tell much of a story.
  • I also don’t map the English-born within the other home-nations, because the population of England is so much larger than in Scotland, Wales etc such that even the small percentage of them moving into the other home nations would dominate the map of Scotland/Wales/NI, if included.
  • I only map a single-country foreign born area if at least 8% of local residents are from that country. This sounds like a low threshold and it is – if an area is coloured a particular colour, it might still have up to 92% of the local residents actually being native-born.
  • The above rule means that some very multi-cultural areas don’t get mapped, because they have a large number of non-native residents, but these are split amongst various countries such that none reaches the 8% threshold.
  • Necessarily, in the source data, some countries are combined together into regions, either for a whole region (e.g. Central America) or for other countries in a region (e.g. Other East Asia, not including China/Japan etc). This is how the underlying Census statistics are represented. This can have the effect of making a result (for a region) appear when it wouldn’t otherwise appear (for any country in the region). However the number of places where this happens is small so it does not overly bias the map.
  • A slight quirk of the census results is that the Scotland and Northern Ireland chose to, based on their own sum populations, aggregate some of the smaller-UK-population countries in a different way. For example, Northern Ireland doesn’t break out “Other Old EU” (e.g. Belgium) and “Other New EU” (e.g. Bulgaria) into separate categories. The Somalian population in Scotland is not presented as a distinct statistic, but it is in NI (and England/Wales). Again, this only affects countries/regions with smaller UK populations so doesn’t overly distort the map.
  • I don’t colour the map where it would be showing data for less than 10 people. This causes a most noticeable rationalisation of the map in Scotland, because the small areas here have a lower population (typically 125 instead of 250 people). This means Scotland’s country-of-birth diversity is a little underrepresented when compared with the other regions of the map.
  • I’ve used colour hues and brightnesses in an ordered way, to group together continents and regions. Greens = UK nations, Olives = Old EU, Browns = New EU, Yellows = North America, Pinks = Central America, Blues = Africa, Purples = Oceania, Reds = Asia. There is no particular meaning to the colours picked beyond this, but be aware that the eye is naturally drawn to some colour hues more than others.
  • If a second country of birth also scores over 8%, but with a smaller local population than the first, then this is shown in striped lines over the first, and labelled as such in the interactive key.

Have a look at the map, and mouse around to find the meaning for the current colour, or see the scrollable key on the right.

Why 8%? I found that dropping this threshold (I tried initially at 5%) results in a lot of “noise” on the map, where only two large families need to move to an area, for it to acquire their birth-country colour. Increasing this threshold (e.g. to 10%, which I tried) results in many of the interesting patterns disappearing.

Interesting, some famous “immigrant” areas of London virtually disappear on this map. Brixton and Hackney are still associated with the Jamaican communities moving there in the 1940s/50s, but, at 8% threshold they virtually disappear. Only at 5% is there a significant community pattern appear. Similarly, Wandsworth and Shepherds Bush are known for their Australian communities but these also almost vanish when moving from 5% to 8%. At a 5% threshold, Hackney and Islington show a “patchwork” effect of integrated multicultural communities of Irish, Turkish, Nigerian and Jamaican-born immigrants. These also disappear largely from the map at 8% threshold. Remnants of the Irish migration to Kentish Town are more obvious.

London remains a fascinating mix where people from many different countries have set up their home in neighbourhoods with established communities and retail that cater for them. While the UK’s other cities have “international” quarters too, none shows the diverse nature of these communities. Virtually every country in the key has a London neighbourhood. (N.B. Places where there are pockets of many nations in a small area in London, and elsewhere, often indicate a student population at a globally well-known university).

Away from London, the Scottish-origin communities in Corby and Blackpool stand out, while the Americans on military bases in East Anglia also dominate the map there. Luton has a Polish, Pakistani and Irish disapora.

As ever, I am mapping small-area statistics, not those for individual houses (I don’t have that information!) and the representation of a particular house on the map is indicative of the local area rather than each house itself. The addition of houses on CDRC Maps maps is intended to make the map more relatable to the population structure of towns and cities, but it can make the data more detailed than it actually is. The map also includes non-residential buildings – there’s no easy way to filter these with the open dataset used, and the great majority of buildings in the UK are residential.

[Update – See this excellent article written by CityLab on this map, which explains some of the above nuances in a better way than I attempted to.]

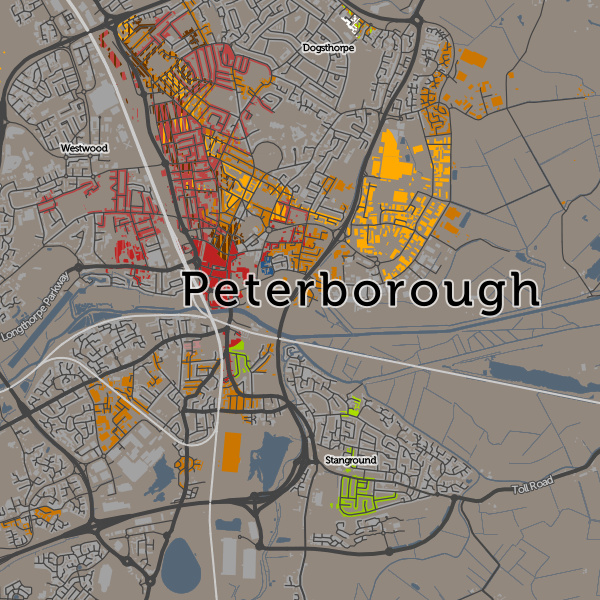
Below: There is a Little Italy, but it’s in Peterborough now.

peterborough_countryofbirth

Categories
London

London Panopticon

Panopticon Animation

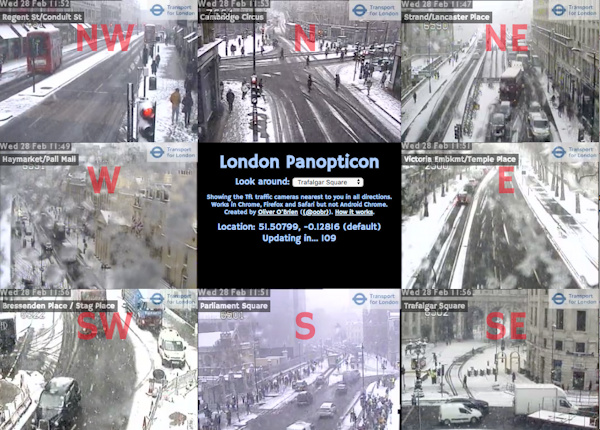
The London Panopticon utilises the traffic camera feed from the TfL API, which recently (announcement here) added ~6-second-long video clips from the traffic cameras on TfL “red route” main roads, to show the current state of traffic near you. The site loads the latest videos from the nearest camera in each compass direction to you. The images are nearly-live – generally they are up-to-date to within 10-15 minutes. If the camera is “in use” (e.g. being panned/zoomed or otherwise operated by an official to temporarily reprogramme the traffic lights, see an incident etc) then it will blank out. The site is basically just JavaScript, when you view it, your browser is loading the videos directly from TfL’s Amazon cloud-based repository.

The Panopticon continuously loops the video clips, and updates with the latest feed from the cameras every two minutes, the same frequency as the underlying source. If you are not in London or not sharing your location, it will default to Trafalgar Square. I’ve added a special “Blackfriars” one which is where the under-construction Cycle Superhighway North/South and East/West routes converge – during rush hour you can already see bursts of cyclists using the new lanes.

Try it at vis.oobrien.com/panopticon and note that it only works on desktop web browsers (I’ve tested it on Chrome, Firefox and Safari). It didn’t work on Internet Explorer “Edge” when I tested it on a PC. It also does not work on Chrome on Android and by extension probably mobile in general. It possibly uses a lot of bandwidth, so this is perhaps just as well.

I’ve named it after the Panopticon, a concept postulated by Jeremy Bentham, co-founder of University College London, where I work, in the 1800s for easy management of prisons. The Panopticon encourages good behavior, because you can’t see the watcher, so you never know if you are being watched. Kind of like the traffic cameras.

The concept evolved from a special “cameras” version (no longer working) of the London Periodic Table, which was itself a follow-on from CityDashboard, both of which I created at CASA. The source is on GitHub.

p.s. If you made it this far, you might be interested in a hidden feature, where you can specify a custom location. Just add ?lat=X&lon=Y to the URL, where the X/Y is your desired latitude/longitude respectively, in decimal coordinates. Example: http://vis.oobrien.com/panopticon/?lat=51.5&lon=0.

Categories
London

The View from the Shard for Londoners

There’s currently a great deal for Londoners who are keen to see the city from the highest viewpoint possible. The View from the Shard currently has a “Love London” pass for sale for just £20.16. This gives you unlimited visits between now and the end of the year – not bad if you consider that, for on-the-day visitors, the regular tourist price, for ONE visit, is £31 (or £26 if you book in advance). Even if you only visit every couple of months between now and December, that still works at £4 per visit. Go half an hour before sunset, go at night, go in the morning on a sunny day, go when the garden opens in mid-June, and go during heavy rain or a lightning storm! On my second visit I missed a big one by just a few minutes.

The Pass

To get it just turn up, buy the pass and then get a ticket for a visit, there and then. The pass is credit-card sized, and digitally stores a photo of you to check against swapping of the card. There’s only a limited number of the cards left, you can only get them from the ticket office in the Shard (open until 9pm every day). You’ll need both photo ID and proof of (London) address to get the pass. For subsequent visits you just flash the pass at the ticket desk and get a ticket. At the time of writing, there are currently “a few” left, the staff are cagey about how many, but a few thousand (2016 + 500 + X?) have been sold so far.

The Journey Up

Getting to the top of the Shard is reasonably involved, although in both visits I’ve made so far (7pm on a weekday and 6pm on a Sunday), there were no queues, either to get the ticket or for the lifts, and the two viewing platforms were both not too crowded – no waiting needed to see the view once you are up. To get there once you have your pass and ticket:

  1. Give your ticket to an attendant who swipes it to open a gate.
  2. You then have an metal-detector gate to go through, with your bags/pocket contents X-ray scanned.
  3. You then get a couple of green-screen photos of you taken (so don’t wear green!), one looking forwards and the other looking up. You get handed a card (to later retrieve the photos to view and/or purchase).
  4. You get given a small PDA containing a guide to the view you are about to see, with optional audio narration.
  5. Down a corridor into a lift to Floor 33, the 30 second journey augmented by a vivid animated display in the ceiling.
  6. Then, an usher shows you around he corner to the second lift, another ceiling visual and 30 seconds later you are on Level 68. Just about there!
  7. There’s a little shop at Level 68, but go straight up the stairs to Level 69, the indoor, and largest, of the two viewing platforms.

The View

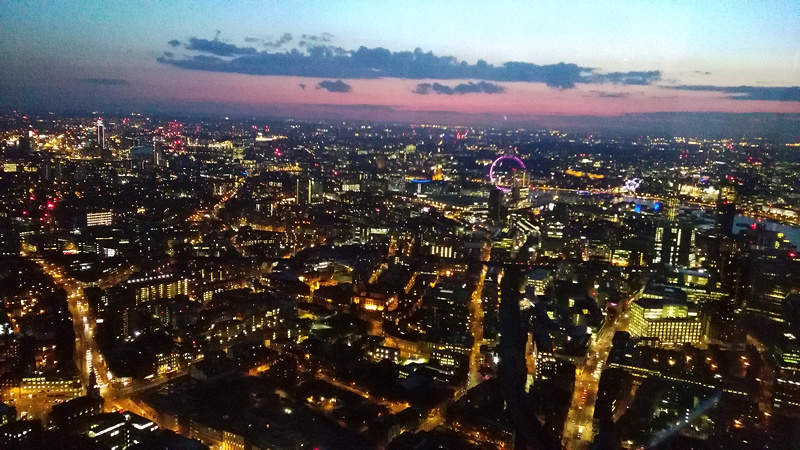
shardtop_1You made it! The building beams cast a reflection on the glass panels which is surprisingly strong but an hour before sunset they turn off the inside lighting, which helps, and after dark it is not a problem. There are also free (yay!) digital telescopes arranged around the edge (press the button on the left to get the live view, which unfortunately does not zoom in as far as the historic image views – take your own binoculars or telephoto lens, if you are trying to spot your suburban home!) The photo at the bottom of this post is the first view you see – looking to the south. It’s the least exciting direction, but is still visually striking. N.B. In this photo, on the top of the building at the bottom, which is itself a 25-floor skyscraper (Guys Hospital), you can spot Wally on the roof. He is there for a few more days, as part of an aerial I-spy.
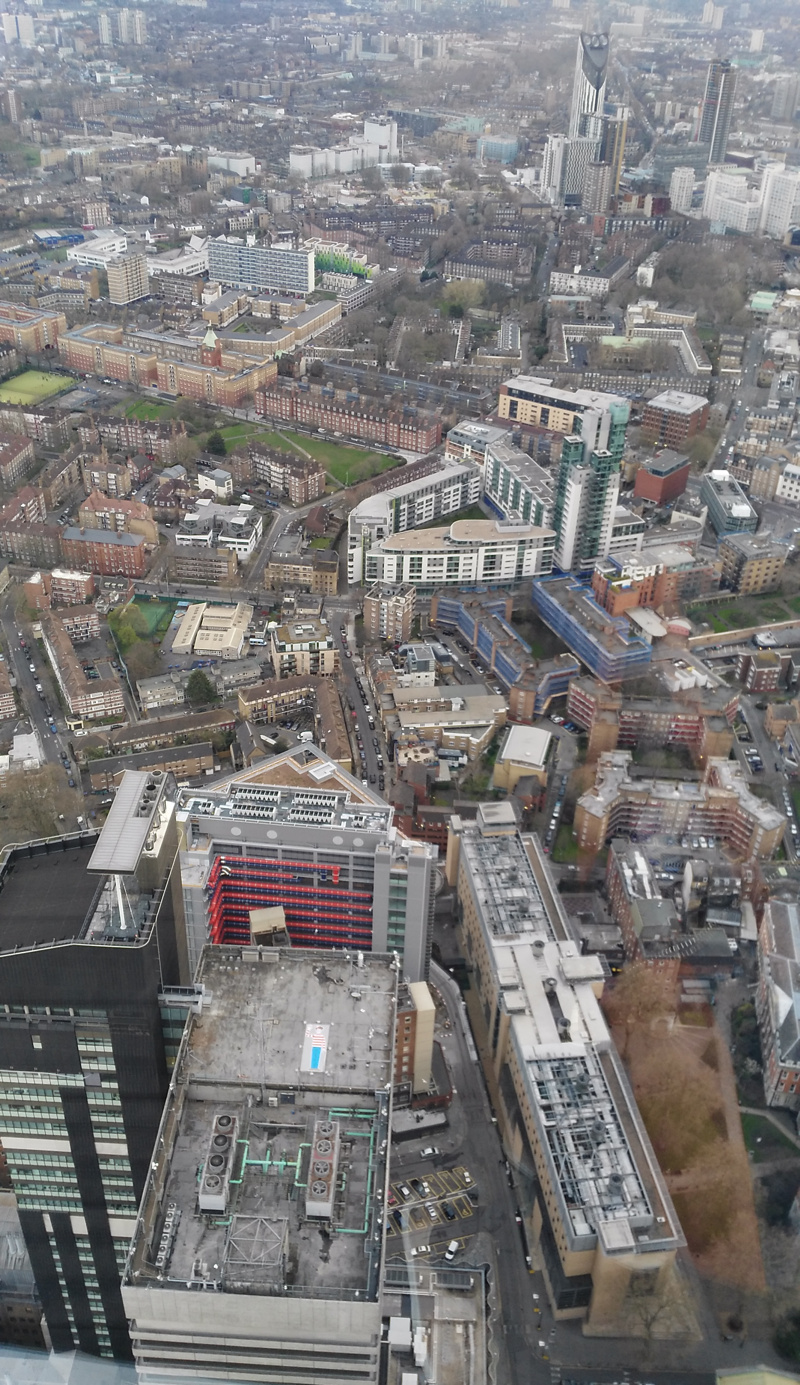
Up three more flights of stairs to get to Level 72, the outdoor platform (though it still feels enclosed as there is glass above head-height, and the core behind you) which also hosts a Champagne bar. The floor is wooden decking, and partially under cover. Don’t forget to look up from this level, in the corners. Here, the view is more open, and you can see the rest of the Shard heading up for a further 17 floors, as it tapers to a point – see the photo above. There is also a further set of stairs up, tantalisingly off-limits to visitors.

The View from the Shard is definitely worth the trip, if you live in London and plan a few visits this year. It’s high enough up (the platforms are nearly 300m) up to give London a “Sim City” (or, at night, “Blade Runner”) feel, and a view which appears to cover the whole of London and – thanks to the continuous urban extent right to the horizon – makes the city look truly huge, in a way that maps, lower viewpoints and aircraft views (too high) don’t achieve.

…oh, and if you need another reason to go, there’s a nice floor map in the sky lobby, half-way up to the top.

Thanks to Diamond Geezer for tipping me off about the Love London cards.

shardtop_2

Categories
CDRC

Working Nation

leicester_industry

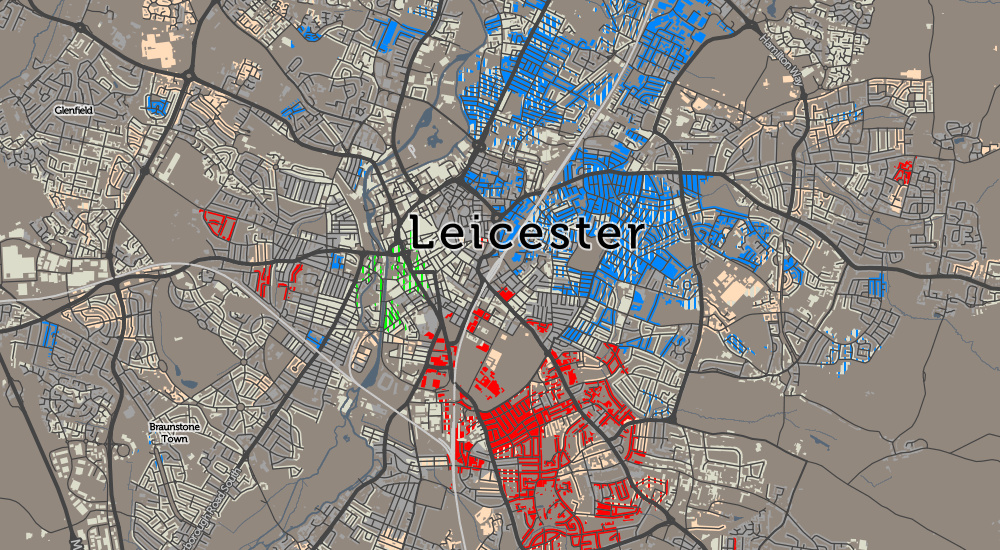
Top Industry maps the most popular employment for each of the ~220000 statistical small areas* within the UK. I’ve reused the “top result” (i.e. modal only) technique that has produced interesting maps for travel to work, to look at the Industry of Employment tables produced by the national statistics agencies, from the 2011 Census.

The tables I’ve used group each job into a Standard Industry Classification (SIC) category, I’ve then mapped which of these is the most popular. I’m mapping the home locations of workers, rather than where they work. I’m also only mapping where at least 20% of the working population falls into one of the categories. The “G: Wholesale retail trade, repair” category dominates through the UK – we are a nation of shopkeepers – so I’ve used a muted off-white colour to represent areas where this is the most popular. Other, rarer categories have more vivid colours.

swales_industryAll sorts of interesing patterns appear:
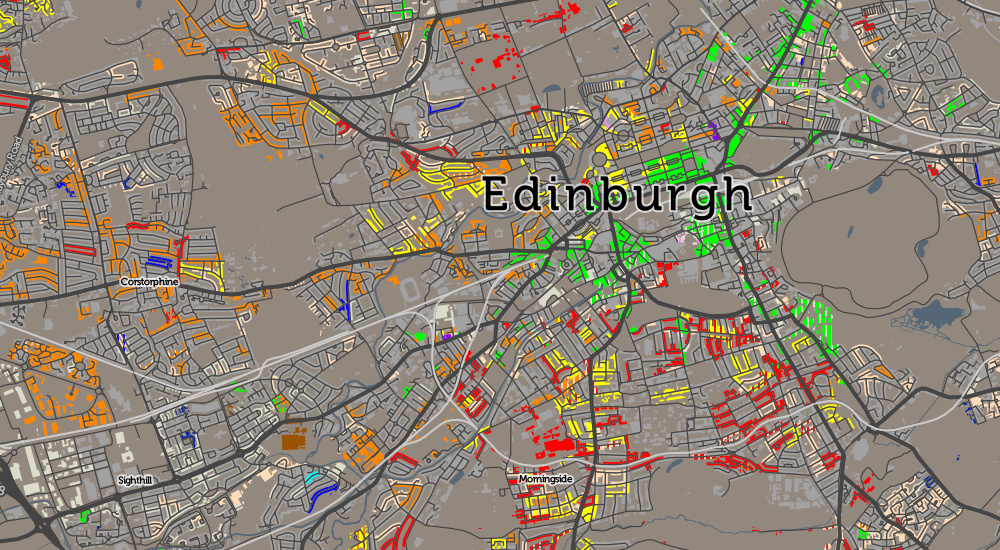
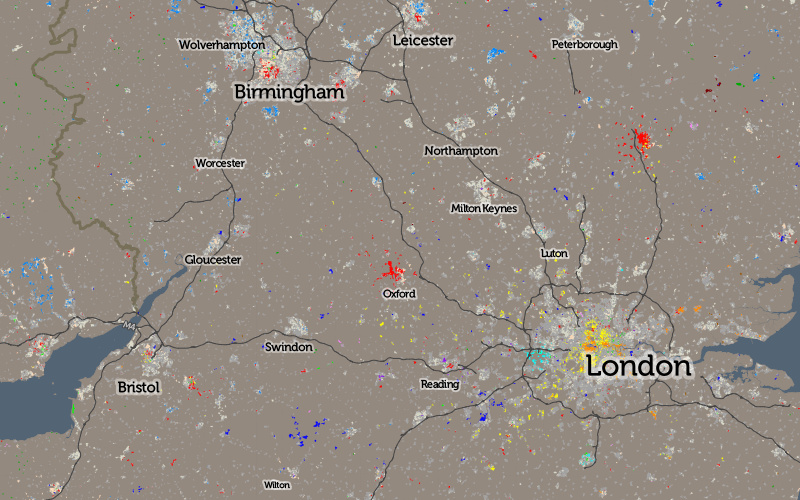
The map shows that the UK is far from homogenous when it comes to the industries and occupations that people work in. It reveals many areas where manufacturing remains the key employer for the local working community – typically mid-sized towns – while showing the diverse and uneven nature of the employment landscape in the larger cities. While remembering that the map is only showing the “top” (and second-top where relevant) industry category, and that other industry workers can also live in the same places, it still shows a structure and pattern consistent both with historical reasons for many of the communities’ development, but also the realities of the modern workforce, with new technology industries, and social work, becoming increasingly prevalent.

See the interactive map on CDRC Maps.
The data is available on CDRC Data.

edinburgh_industry

* Known as Output Areas in Great Britain and Small Areas in Northern Ireland.

sengland_industry

Categories
BODMAS Geodemographics

The Battle of the Roads

ttwm_miltonkeynes

Following on from my two maps of the small-area modal method of travel to work – one map includes cars and so is most interesting for London, and one map excludes cars and so is most interesting for the rest of the country, where cars otherwise dominate – I’ve refined the car-excluding map and introduced a third one.

The Refinement: Map Meaningful Results Only (>10%)

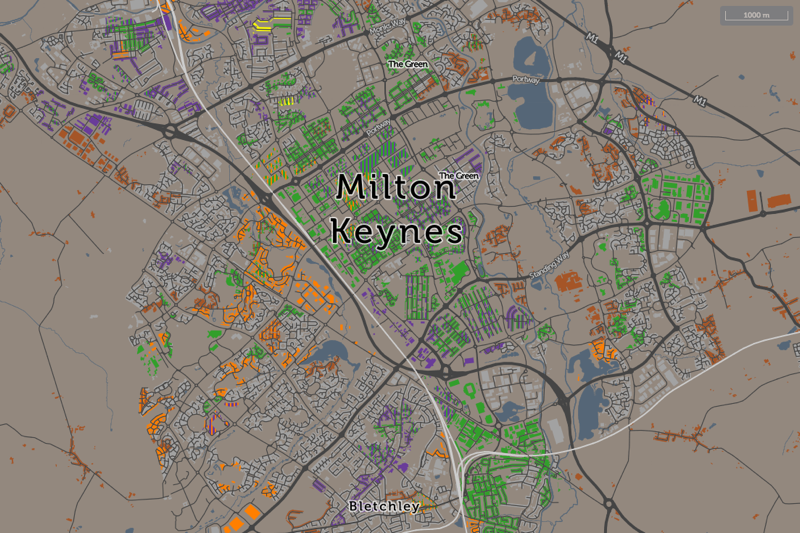
I was mapping the second most popular method of travel to work, after cars. But for many areas, there is no sensible second method. Therefore, I was often mapping results for extremely small numbers of people. One person cycling to work while the other 199 drive, in a small area, does not tell us much. The more interesting result is the lack of a strong non-car travel mode. So, I’ve refined the map to remove the colour where it is representing less than 10% of workers. For areas with good public transport options, or a strong tradition of working from home or walking to work, the map is largely unchanged, but for other areas which are sadly dominated by the motor car, the map now shows large areas of grey.

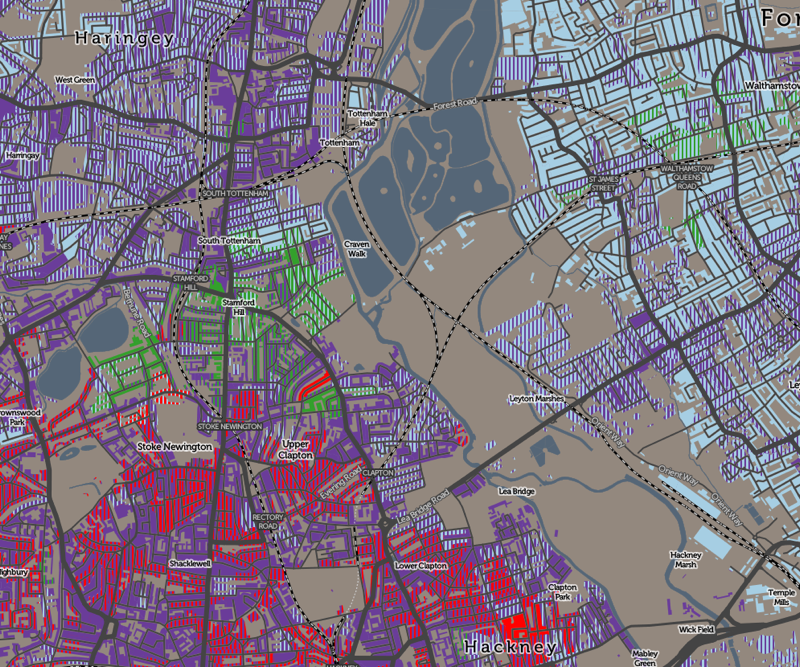
Four notable areas of greyness are Milton Keynes, the Welsh Valleys, Telford and Middlesbrough. In large conurbations, distinct areas appear, such as Walderslade near Chatham, the outer parts of Swansea or the eastern half of Cannock. London changes little, the nearest car-only area being Sunbury on Thames, which is technically just outside London but within its sphere of influence, if not its public transport options.

Additionally, I previously was also showing a “runner up” non-car mode of travel, where this fell only slightly behind the main mapped mode. This additional mode was shown using vertical stripes. However, I’ve tweaked this so that it is instead always included if, like the primary non-car mode, it also represents at least 10% of workers there. This has most effect in London, where buses are in fact widely used right across London, even if the tube/train mode is also heavily used. So London now is mainly composed purple stripes (bus) on top of orange (tube/train). This change also brings out the cycling mode in a number of other cities, notably Hull and Bristol, cities where public transport is well used – and so was masking the still-popular cycling mode.

The New Map: Road Users Only

I’ve introduced a third map, focusing on road travel only – so I’ve eliminated tube/metro use, as well as working from home.

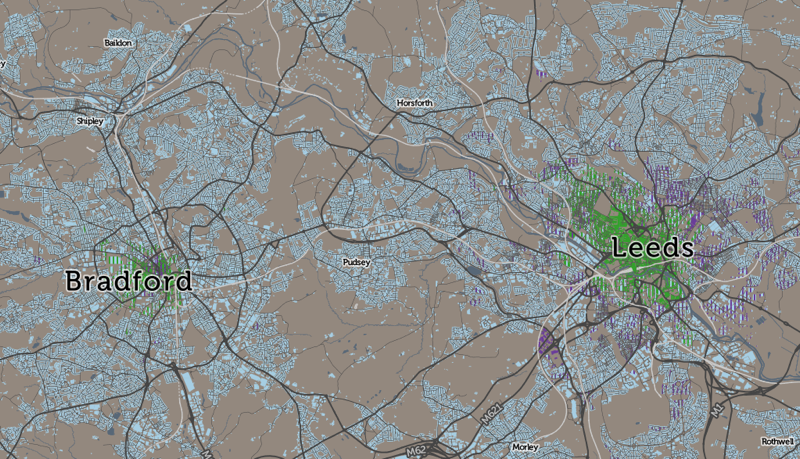
Do the buses beat the cars (remember though, there are more people on a typical bus than in cars), or do the cyclists beat both? Well – mainly it’s the cars, with most cities and other urban areas showing a walking core, surrounded by cars. Inner city areas often have bus use appearing, typically as a second-place usage (I only show here, unlike above, it where it nearly is as widely used as the main mode) in some sectors, but not others. Leeds and Bradford both show this pattern:

ttwn_leedsbradford

London is the stand-out exception with heavy bus and bike usage, across wide areas well away from the centre. Taxis are also popular with the rich of Kensington.

But in some towns and cities, even the central walkers lose out. Telford is one place with no walking core. Wellingborough/Rushden is another, and Boston. Margate/Ramsgate’s is unusually small. In these places, at least, the car is king of the roads, throughout the urban realm.

Note: Like all the travel to work maps, I’m mapping small-area statistics for the residential location (i.e. home) of people that are of working age. Each small area has a typical working population of around 200 and typically represents two or three average-length residential streets. The maps include non-residential buildings by necessity, as I do not have data to eliminate these, but the colours/stats only represent the nearby residential population, not people who work in these buildings.

ttwm_stamfordhill

Categories
Data Graphics OpenLayers

named

named_lennon_mccartney

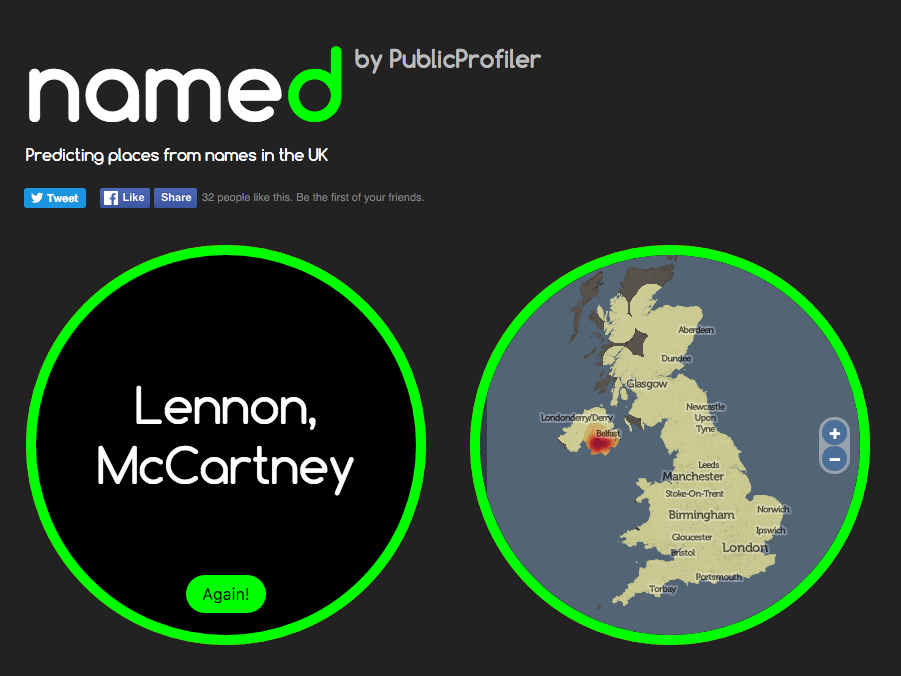
named is a little website that I have recently co-written as part of an ongoing ESRC-funded project on UK surnames that we are conducting here at UCL Department of Geography. I put together the website and adapted for the UK some code on generating heatmaps showing regions of unusual popularity of a surname, that was created by researchers in the School of Computing, Informatics & Decision Systems Engineering at ASU (Arizona State University) in the USA.

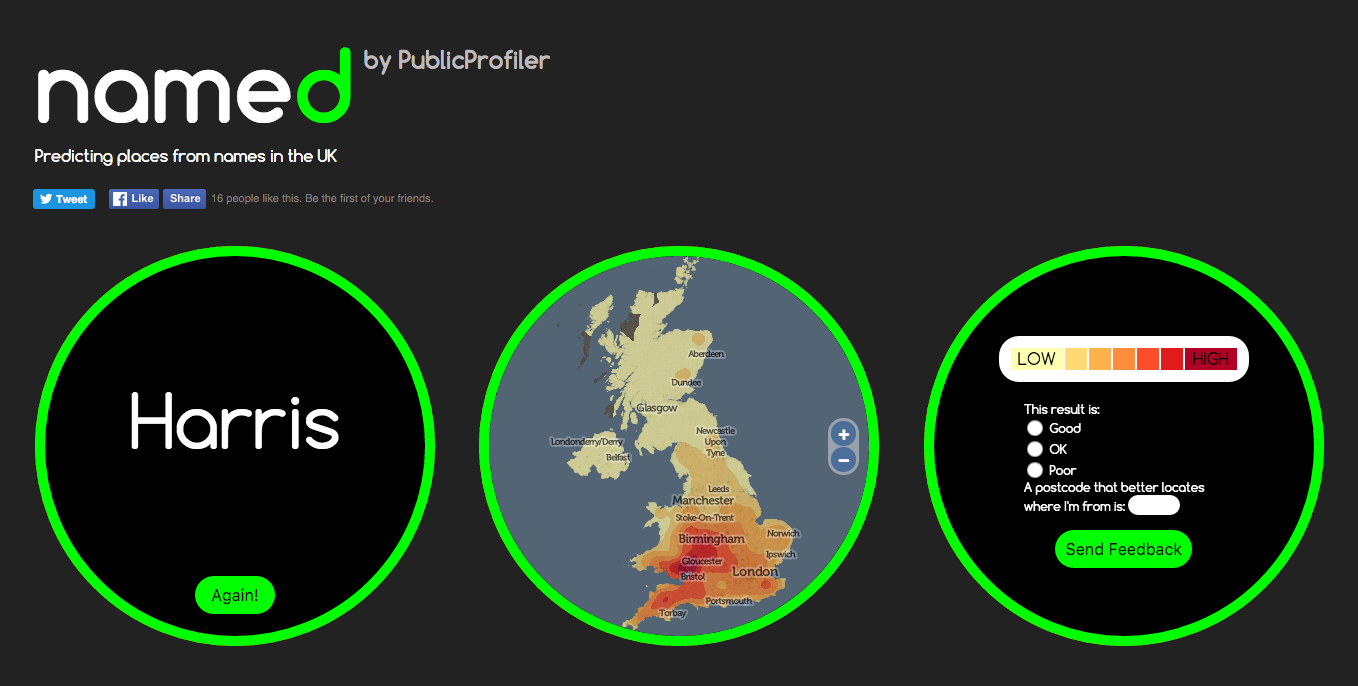
The website is deliberately designed to be simple to use and “stripped down” – all you do is enter your surname and the website maps where in the UK there is an unusually high number of people with that surname living. There is also an option to enter an additional surname (for example, a maiden name for yourself or your partner, or the name of a friend) – and, by combining heatmaps of both names, we try and draw out where we think you might have met each other, or grown up together.

The Research

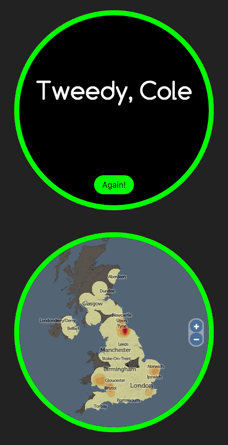
named_tweedy_coleOf most interest to us is the quality of the technique with pairs of surnames. It is well known already (for example, J A Cheshire, P A Longley (2012) Identifying Spatial Concentrations of Surnames, International Journal of GIS 26(2) pp309-325) that most traditional UK surname distributions remain surprisingly unchanged over many years – internal migration in the UK is a lot less than might be traditionally perceived. One of the research questions in the underlying project is to see whether this extends to marriages and other pairings too. So we encourage you to use this mode and help us understand and evaluate pairing surname distributions and patterns.

The site is also a useful information gathering tool – we are only in the early stages of evaluating the validity or accuracy of this method – we know it works well for certain regional UK names which are not too popular or too rare, at least. We ask for optional quick feedback following a search, so we can evaluate if the result feels right for you. So far, with the website been operational for around a week, nearly 10% of people are giving feedback, and around half of those suggest that it is good result for them. If it doesn’t highlight where you live now, it might be showing your ancestral home or other region that you have a historical link to. Or it may be showing complete rubbish – but let us know either way!

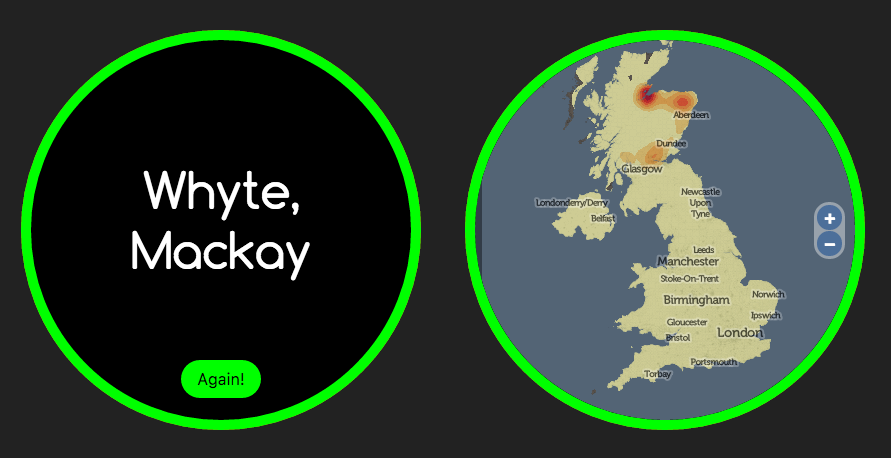
named_whyte_mackay

Try it out for yourself – visit here and see what it says for your surname. The site should be quite quick – it will take up to 10 seconds for names which have not already been searched, but is much faster if getting information that’s previously been searched for.

How it Works

The system is creating a probabilistic kernel density estimate (KDE), based on surname distributions (in a postcode) for an old electoral roll. It finds the relatively frequency/density of the surname compared with the general population in the area. So, in most cases, it will often highlight an area in the countryside – a sparse population, but maybe with a cluster of people with that surname. As such, it will only rarely highlight London and the other major cities of the UK, except for exceptionally urban-centric surnames, typically of foreign-origin. The method is not perfect – the “bandwidth” is fixed which means that neighbouring cities and other population fluctuations can cause false-positive results. However, we have seen enough “good” results that we think the simple has some validity, with the structure of the UK’s names.

named1

Design

On a design perspective, I wanted to build a website that looks different from the normal “full screen slippy maps” that I have designed for a lot of my research projects. Maps are normally rectangular, so I played with some CSS and a nice JQuery visual effects library, to create a circular map instead which appears to be on the back of an information disc.

Data Quality and Privacy

The map is deliberately small and low on detail because having a more detailed map would imply a higher level of precision for the underlying names data than can actually be justified. The underlying dataset has issues but is considered to be sufficient for this purpose, as long as the spatial resolution is low. Additionally, for rare names where a result may appear for only a small number of people with that name (when in rural places) we don’t want to be flagging individual villages or houses. The data’s just not good enough for that, for many names (it may well be good for some) and it may imply we are mapping exact data over someone’s house, possibly raising privacy issues – we are not, the data is not good enough for that but by coincidence it may still happen to line up with a very local feature if it was high res.

It should give an indication into the general area where your name is unusually popular relative to the local population there (N.B. not quite the same as where your name is popular in absolute terms) but I would be wary of the quality of the result if you were identifying a particular small town or exact location.

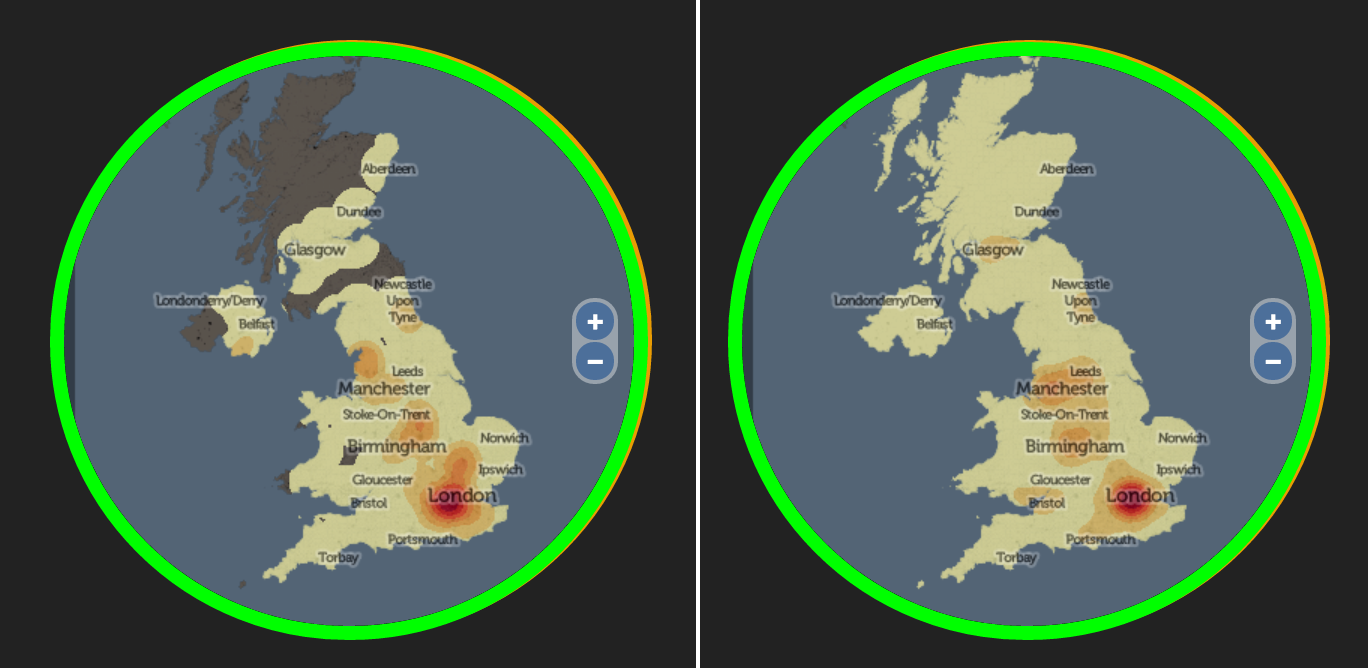
[A little update as one user worried that it was just showing a population heatmap. This would only happen for names which have a higher relative population in more dense area of the UK. Typically, older common foreign origin names will most likely show this, as foreigners traditionally migrate to cities in the UK first. The only name so far that I’ve seen it for (I haven’t tested it for many) is Zhang which is a very common surname. Compare Zhang (left) with an overall population heatmap (using the same buffer and KDE generation as the rest of the maps):

named_zhang_allpop

Some newer foreign origin names show an even more pronounced urban tendency, such as Begum and Mohammed.]

More…

Try named now, or if you are interested in surnames across the world, see the older WorldNames website, and for comparisons between 1881 and 1998 distributions in the UK, see GB Names.

If named shows “No Data” and you have entered a real surname, this may be because there are only very few of you on the UK – and in this case, I show the “No Data” graphic to protect your privacy. Otherwise I’d be mapping your house – or at least, your local neighbourhood.

Categories
Conferences

ICA/Esri Cartographic Summit

cartosummit_james
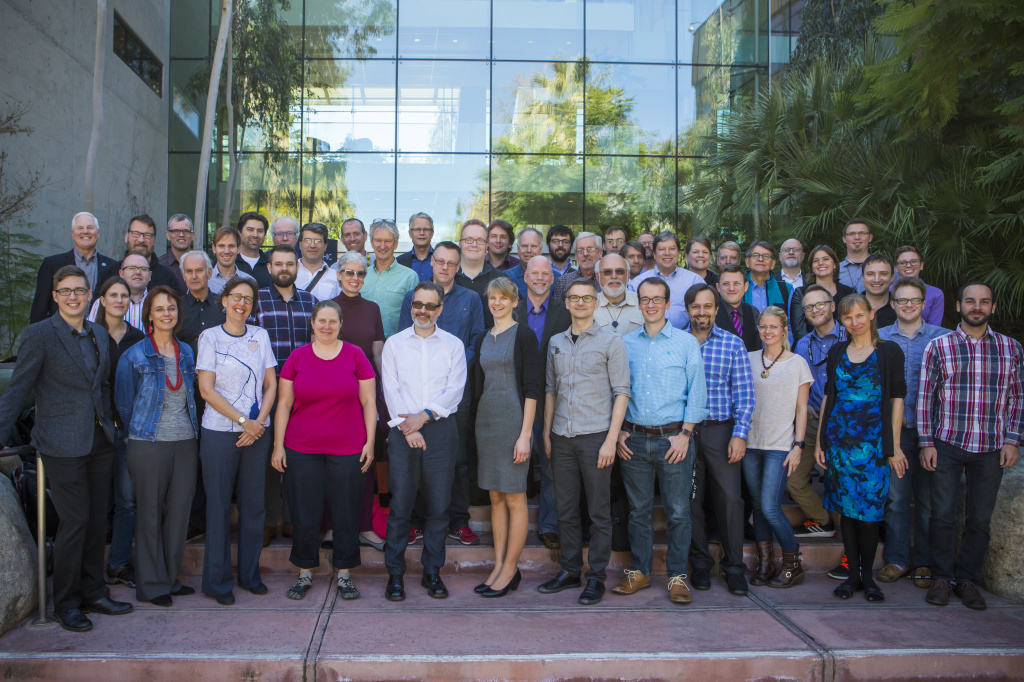
I attended the Cartographic Summit “The Future of Mapping” (#cartosummit) which took place at the Esri campus in Redlands, California, earlier this month. Some notes from the week, which was co-organised by Esri and the ICA (International Cartographic Association). Here are some notes about the event, which I’ll continue to add to/tweak over the next few days.

  • The attendee list included some key names in modern cartography, including Cynthia Brewer, creator of the “ColorBrewer” set of colour ramps which I use widely in almost all my output mapping, such as in DataShine and many of the datasets on CDRC Maps
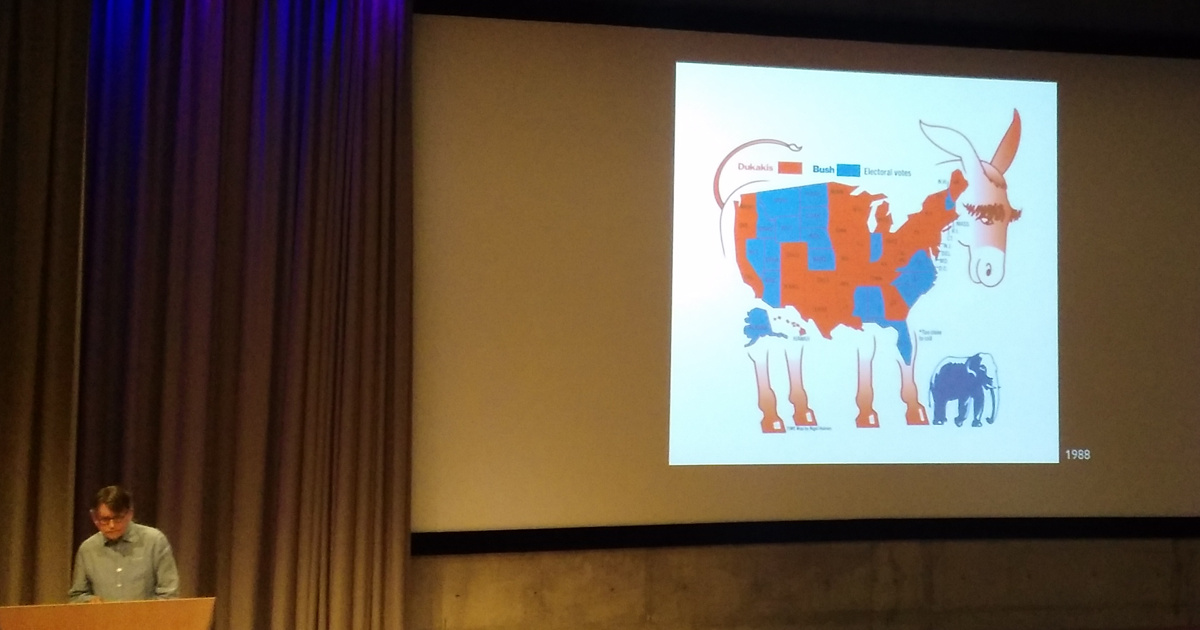
  • It was a good natured event. The only map that came in for (justified) criticism from a presenter was – unfortunately – one of my own! Former TIME graphics director Nigel Holmes (below, showing an old US election map) was perturbed to find that my Dwelling ages map seemed to be suggesting that his old house was 50 years younger than he knew it to be. The problem was compounded by some notes he referred to in this blog, which indicated a low proportion of the dwellings on the area concerned were being mapped. It is fair criticism – the detail on my map implies a level of precision that is simply not true – my counter argument being that people like to see maps of recognisable features rather than generalised blobs representing villages and towns. I think what I need to do is revisit the mapping and indicate such low proportion areas using an “uncertainty” indication such as fading out the colour…
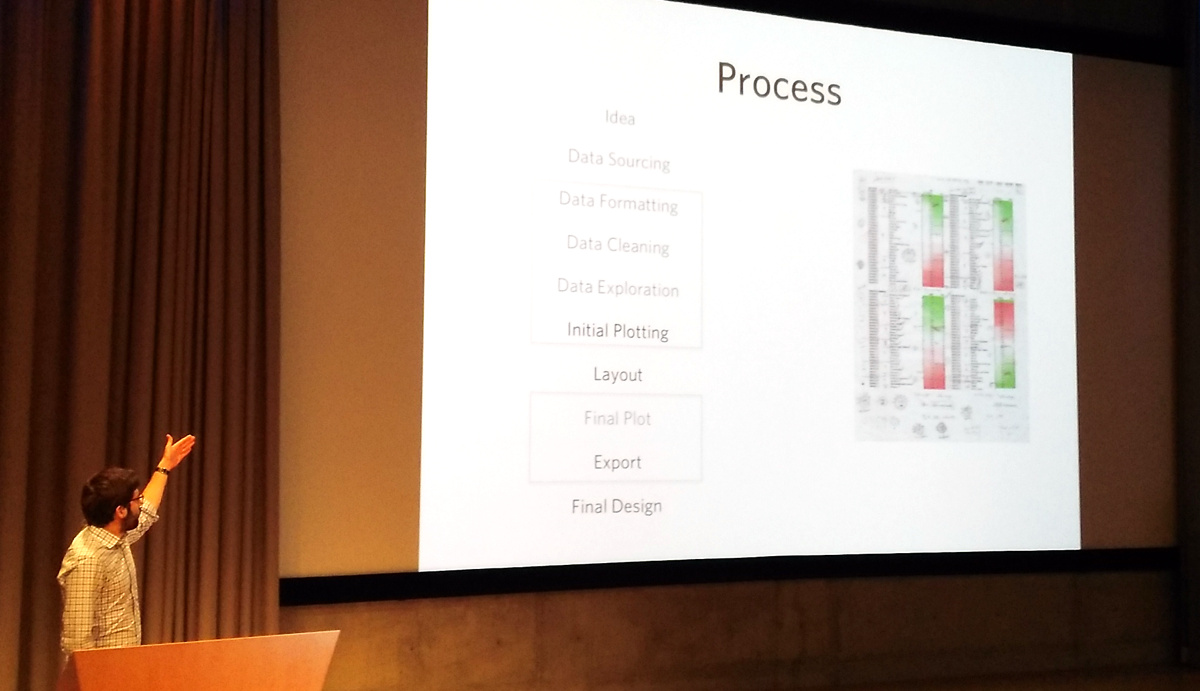
  • James Cheshire of UCL (photo above) presented early on the conference and got straight to the point – that good maps are hard to do and, when they are done right, it’s hard to spot the effort and skill that goes into them. The proliferation of bad maps throughout the web is testament to this. He used the production process he developed for his recent book on mapping London datasets, to drive home the additional steps (shown in bold above) needed to turn a good map a great map, and reinforced the need for time – there are plenty of tools out there that allow good maps to be produced, but great maps still need care and attention.
  • Alan McConchie of Stamen talked all too briefly about the wonderful basemaps produced at the studios, including the famous “Watercolour” digital map.
  • Gary Gale of W3W looked ahead and reinforced the point that far from being an old-style industry, cartography has never been more current or key.
  • Ken Fields of Esri gave us a dizzying tour of new cartography that he has been experimenting with over the last couple of years. He also gave a sneak peek of a very interesting looking book that he is currently working on…
  • There was good academic representation in the audience, however there were some notable gaps. Commercial considerations are understandable but it was a pity there were no representation from Google, HERE, CartoDB or – especially – MapBox. The digital cartography groups within these organisations are producing great things. MapBox, in particular with its huge number of GitHub open source projects such as CartoCSS. MapBox did get a mention in one of the later talks, relating to Esri’s ongoing work to implement the MapBox Vector Tiles (MVT) format. The absence is perhaps reflective of Esri being the co-sponsor and host, who may therefore be reluctant to provide the other organisations with a high-profile platform but it still remains the fact that no discussion of modern digital cartography can be complete and representative without including the excellent work by these groups. Having said that, the small guestlist and excellent facilities provided for breakouts and discussion, allowed for good networking opportunities and gave everyone time to discuss cartographical insights with key professionals, an opportunity likely not afforded at a larger, less focused event.

cartosummit_nigel

My key take-away from the event is that digital cartography is now more important than ever. The plethora of tools available in the “market” now for creating maps has never been larger, but the need to create maps, which present the data fairly and impartially while engaging the viewer and encouraging them to explore, is just as critical as it has ever been. Anyone can make a map now, but creating a great map is very much a skill.

A very timely, useful conference and very much shows the need for a dedicated cartography track at the major industry and academic conferences in the GIS/geovis/datavis fields.

cartosummit_attendees

Categories
BODMAS Geodemographics

What if There Were No Cars?

Here’s a map of the top method of travel to work, for each “small area” (~250 people) in the UK, for people aged 16-74 and in employment, at the time of the 2011 Census (or try the interactive, zoomable version):

traveltowork_car

The pattern is, fairly evenly, that car use (light blue) dominates except for people living in the very centre of cities, where walking to work (green) is the most popular method. The two big exceptions are London, where rail/metro travel (orange) dominates for the inner city zone, separating the walking core and car-driving outer London ring; and Cambridge, where the cyclists (red) really are king. There are some other interesting results in small areas (e.g. walking is popular in central Leicester but not in the centre of Peterborough), but overall, the map doesn’t tell you much more.

So, I’ve considered what the map would look like if we removed cars from the calculations – what form of transport is used by the people that need to work but don’t own or otherwise have access to cars, either as a driver or passenger? How does the UK commute, without cars, right now – and what might a UK landscape look like without the great rush-hour traffic jam, if the alternatives, pro-rata, were adopted? A whimsical hypothesis – cars are always going to be essential for certain kinds of commutes in certain parts of the UK – but let’s see what happens anyway, as it will still tell us something about public transport provision, city walkability and maybe attitudes to working life in general.

Here is a map of the top carless commute method for small areas, right across Britain:

traveltowork_nocar

(Here is the interactive, zoomable version).

Suddenly, all sorts of interesting trends emerge. In rural areas, working from home dominates – with no public transport, and motorbikes being an uncommon form of transport in the UK, this is the only option. In towns and villages, and in city centres, walking to work dominations. Both are obvious – the interesting results appear if you zoom in:

  • In London, the central walking-to-work area (green) coincides almost perfectly with the congestion charge zone. Other walking areas include the large outer London town centres of Hillingdon, Croydon and Kingston that have been absorbed into the metropolis, and the traditional community of Stamford Hill.
  • Rail/metro (orange) dominates throughout Zones 2-6 London and beyond.
  • London has four major areas of bus dominance (purple) – Burgess Park in the south, Hackney in the north-east, the western Lea Valley in the north and a huge zone surrounding Heathrow Airport in the west. Three of these not surprisingly coincide with areas of poor rail/metro provision, but the western Lea Valley result is interesting – there are two rail lines down through this area with stopping services. However, notably, this area’s most popular employment type is cleaning – cleaners typically have to work nights, where the bus is the only public transport option.
  • York versus Leeds – both have a similarly sized walking core, but then the rest of Leeds has bus users, while York’s outskirts are dominated by cyclists (red). The flatter nature of York is likely the major reason.
  • Buses are pretty crucial in the Birmingham conurbation.
  • Cycling dominates in almost every part of Cambridge but less so in the other famous cycling city, Oxford. In London, Hackney’s famed cycle community actually has roughly equal prominence with both bus and train/metro use.
  • Stoke-on-Trent has a very large walking core, larger than for the larger cities, covering the whole area almost, rather than being surrounded by bus/cycling/train commuters as normally happens. Stoke-on-Trent is actually a conurbation of six towns, with employment scattered throughout rather than concentrated in the normal core. Alternatively this could be due to poor bus provision or a dominance of driving.
  • Ilkley and Bingley like their trains – nearby Keighley and Skipton, nearby and on the same network, don’t. The former two towns perhaps act more as commuter towns for Leeds while the latter two have a tradition of more local employment.
  • The very richest areas have a high proportion of people working at home (brown) – live in help, aka domestic servants? See Knightsbridge and Hampstead Garden Suburb in London, or Sutton Park near Birmingham, are two examples.
  • The new towns in central Scotland seems to have a greater proportion of working-at-home than equivalent new-town areas in England.
  • Fishing communities (yellow – other) are obvious in north-east Scotland:

traveltowork_nocar_fish

These are just a few of the spatial patterns I’ve spotted – there are I’m sure many more interesting ones. Sometimes, removing the dominant factor reveals the interesting map.

The technique of mapping only the most dominant mode of transport has a serious flaw, in that, depending on how you merge or split other transport modes, you can significantly influence which appears “top”. I have merged some modes together (driver+car passenger, train+metro+tram, and taxi+motorbike+other, e.g. boat), hopefully in a meaningful way that shows interesting results without hiding the bigger picture. Another mitigating factor is that, where a second mode of transport has nearly as much use as the first, I include its colour too, in narrow vertical banding, and highlight this in the interactive “area information” panel.

All the maps in this article use the CDRC Maps platform, created by the Consumer Data Research Centre, to map small-area consumer and other demographic data for the UK. Because I am using Census data, I am able to map for the whole of the UK (including Scotland and Northern Ireland), as, for the Census at least, the activity is coordinated across the nations, and while the outputs are arranged differently, they are sufficiently similar to combine and use together with care. The data comes from the National Statistics agencies – the ONS, NRS and NISRA, and is Crown Copyright, licensed under the Open Government Licence.

Have a look at some other CDRC datasets mapped, download the data yourself or find out more about the CDRC.

traveltowork_nocar_cambridge