Categories
BODMAS

DataShine Wins the BCS Avenza Award for Electronic Mapping

bcsavenza

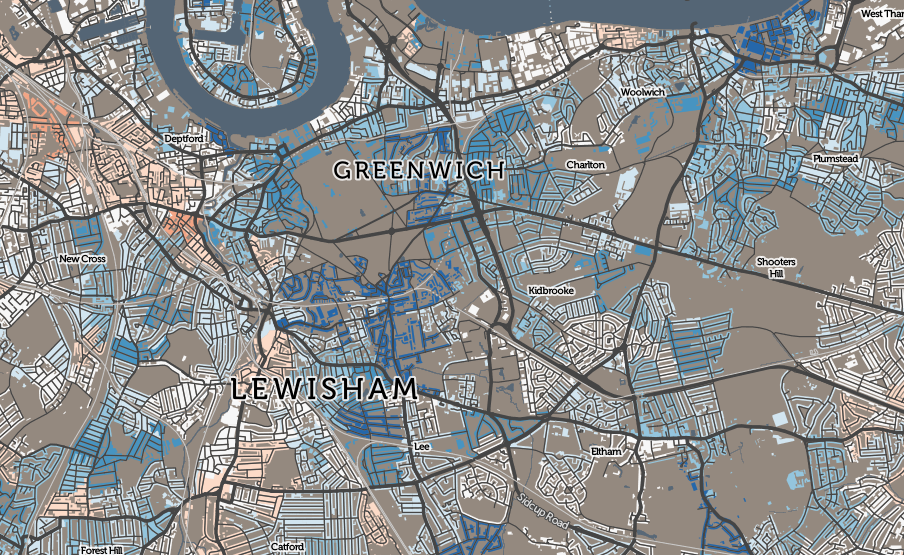
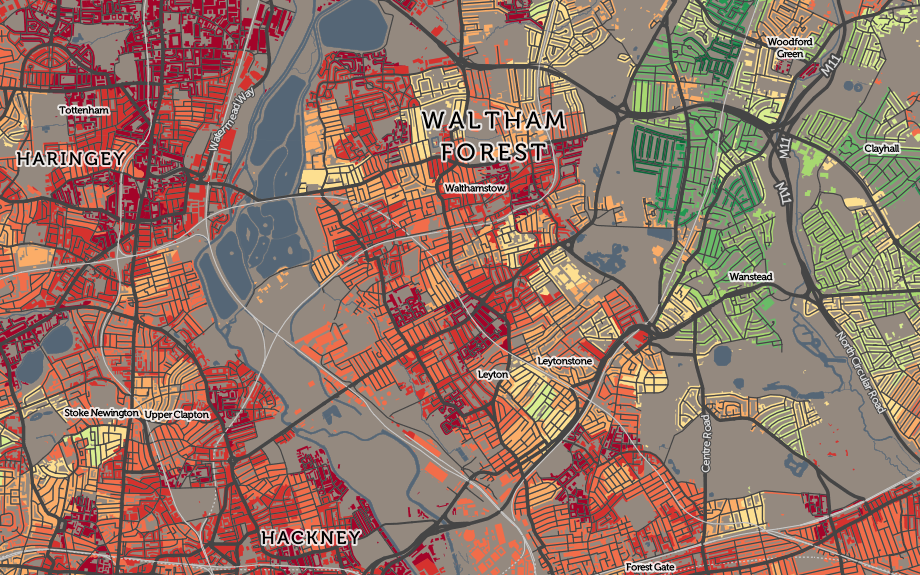
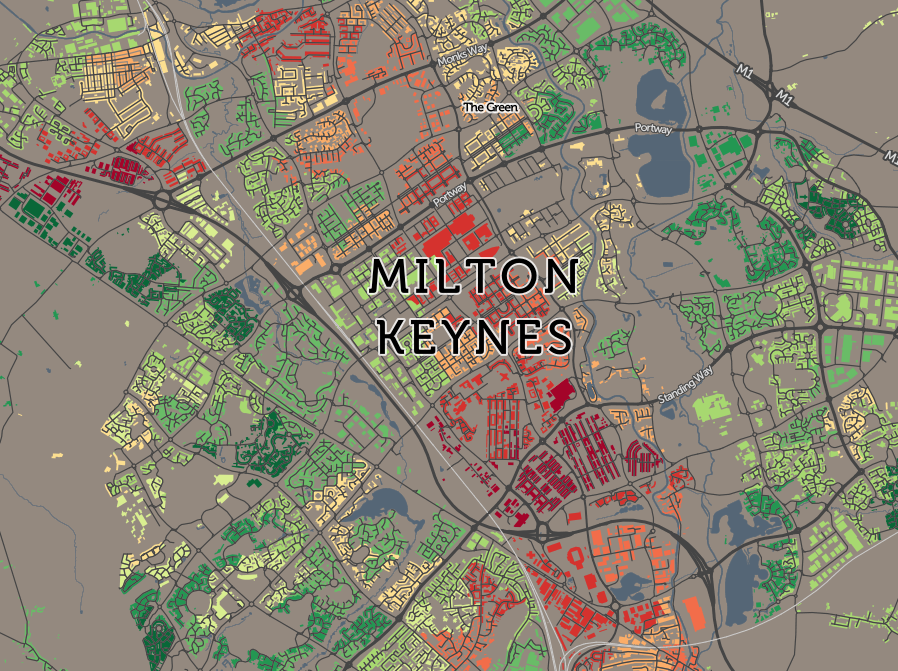
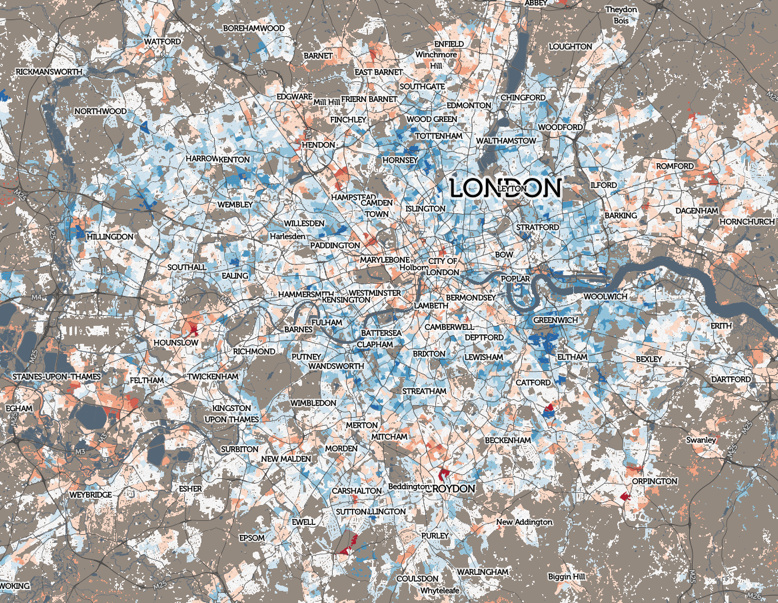
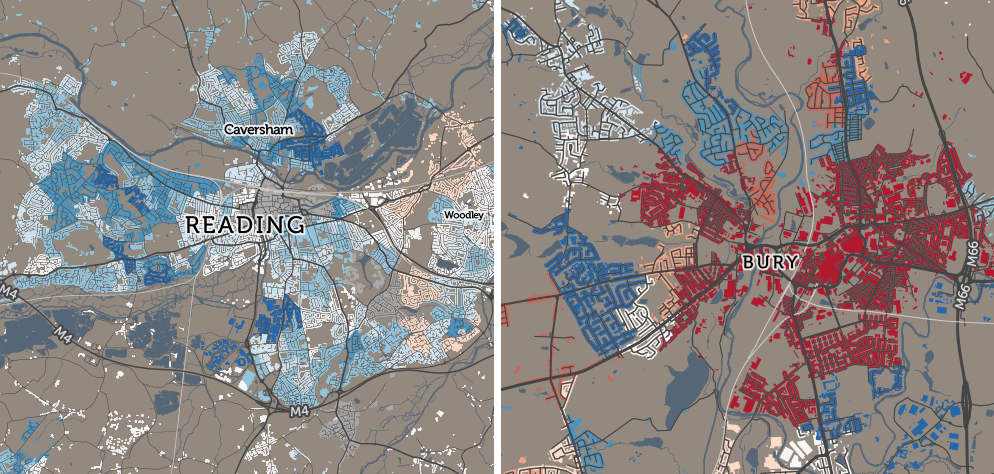
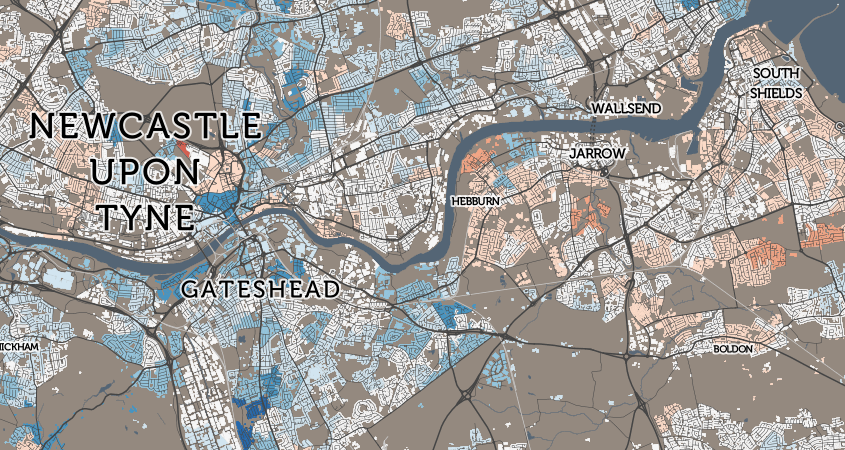
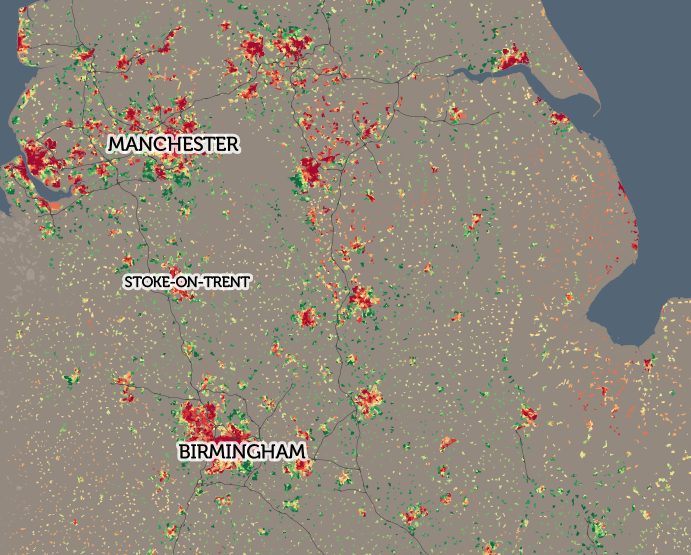
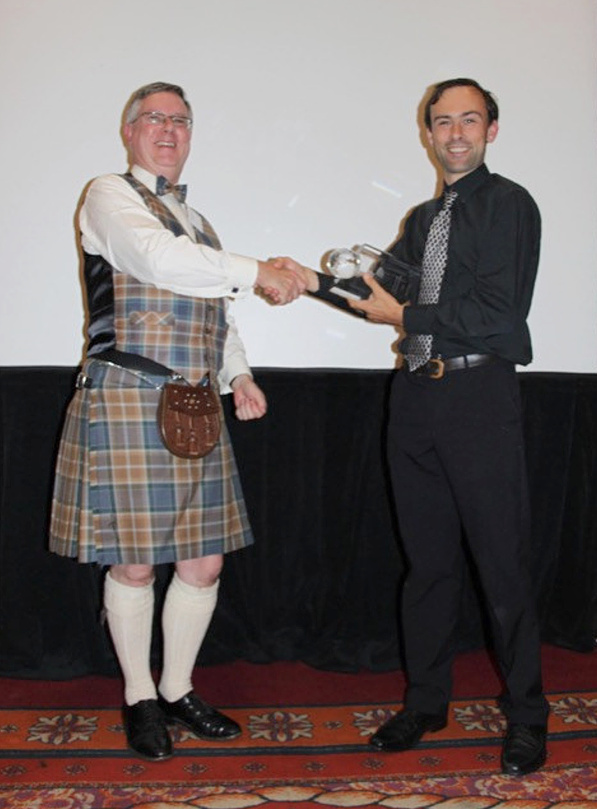
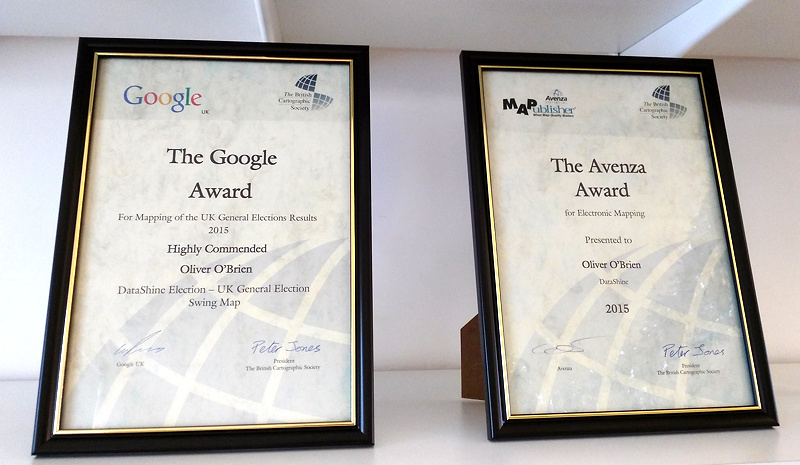
DataShine Census has won the British Cartography Society’s Avenza Award for Electronic Mapping, for 2015. The glass trophy and certificate were presented to DataShine creator Oliver O’Brien at the award ceremony and gala dinner for the combined BCS/Society of Cartographers conference “Mapping Together” which took place in York, earlier this September. The prize was presented by Peter Jones MBE, the BCS President.

Additionally, DataShine Election was Highly Commended for the Google Award for mapping of the UK General Election 2015.

The book “London: The Information Capital” which DataShine PI James Cheshire co-authored with Oliver Uberti, won three awards at the same ceremony, the Stanfords Award for Printed Mapping, the John C. Bartholomew Award for Thematic Mapping (for Chapter 3 of the book), and the meeting’s grand prize, the BCS Trophy. Dr Cheshire was on hand to receive the trophies and certificates.

The awards cap a successful year for the DataShine project which has seen hundreds of thousands of viewers, several key media articles and four key websites launched, along with a number of variants, most recently including DataShine Scotland Commute which was commissioned by the National Records of Scotland. Full details of the project can be found on the project blog.

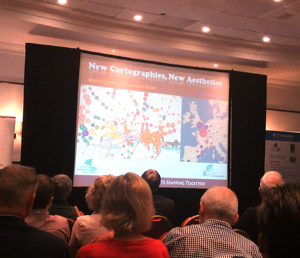
neocartography_presentationThe awards were just a small part of a eye-opening and rewarding two-day conference held in central York. A wide variety of talks were held, from academics, company representatives and field enthusiasts. They ranged from detailed discussions of subtle automated cartographical techniques that improve the legendary “Swiss Topo” national maps of Switzerland, to a not-so-serious critique of maps supplied by the floor – a sea/land temperature gradient map proving to be particularly controversial due to its multi-hue, repeating colour ramp. A particular highlight was a discussion on “neocartography” by Steve Chilton, he framed the presentation around an email conversation he’d had with myself and another “experimental” mapper SK53.
The theme “Mapping Together” represented the combination of the annual conferences of the trade-focused BCS with the academic-weighted SOC, the two professional cartography bodies of the UK, for the first time in several years. The format worked well and there was enthusiasm at the meeting for it to be repeated in future years.

bcs_datashinecertificates

This is an extended version of an article that first appeared on the DataShine blog. Photo below courtesy of the Society of Cartographers Publicity Officer.

bcs_avenzaaward2015

Categories
Conferences

ECTQG 2015

ectqg_2015_alistair

Just a quick report on the 19th European Colloquium on Theoretical and Quantitative Geography, which took place near Bari in Puglia, South-east Italy, earlier this month, and which a significant amount of the quantitative geography group here at UCL attended, including myself. The meeting was held at an agricultural college in a university town a few miles from Bari itself, and was held Friday-Monday, which emphasised the residential nature of the meeting.

A couple of frustrating aspects, which persisted throughout the weekend, were some relatively uneven grouping together of talks on unrelated topics into a single session, and also a relatively large number of talks were included on the programme despite being from presenters who had submitted abstracts but weren’t present at the actual meeting, resulting in quite a few gaps or sessions. In one case, the first of three OpenStreetMap sessions was cancelled after most presenters were absent, but the three sessions were later being regrouped (unannounced, so I missed it) into a single session with seven presenters squeezed into the time for five. In another case, one person had been allocated to chair one session while giving a presentation simultaneously in another stream!

Positives from the conference though were the excellent food provided, the weather meaning that several of the meals could be taken outdoors – as well as at the grand gala dinner in a hotel in central Bari. The local feral kittens also provided entertainment, particularly for us Brits who are suckers for such things! We also managed some time off to visit Monopoli, a lovely little town about 30 minutes from Bari, with a pleasant old town and central square, a small (sadly, too small) bikeshare system, and apparently almost completely off the tourist radar.

Next ECTQG is much closer to home – the Leeds part of the CDRC research group that I am affiliated with are organising it somewhere in Yorkshire in 2017.

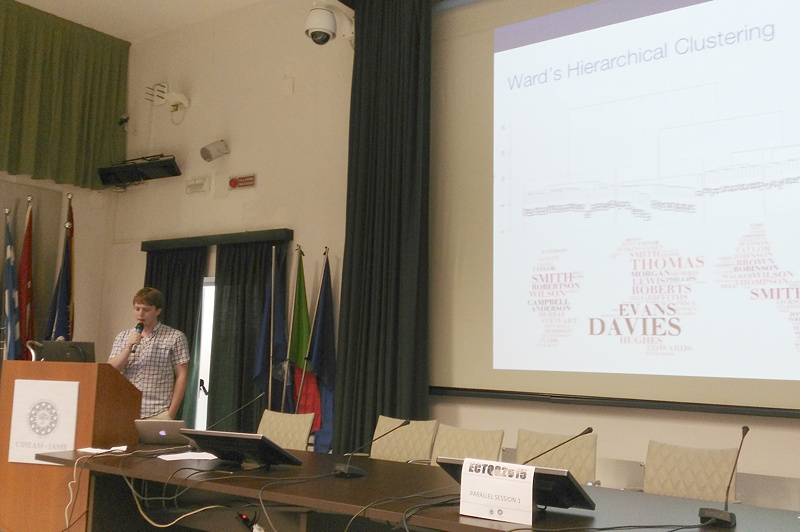
Above: Alistair Leak discusses Ward’s hierarchical clustering for surnames, as part of his presentation at the colloquium. Below: An evening meal outside.

ectqg_2015_dinner

Categories
Data Graphics London

Living Somewhere Nice, Cheap and Close In – Pick Two!

eastsheen

Skip straight to the 3D graph!

When people decide to move to London, one very simple model of desired location might be to work out how important staying somewhere nice, cheap, and well located for the centre of the city is – and the relative importance of these three factors. Unfortunately, like most places, you can’t get all three of these in London. Somewhere nice and central will typically cost more, for those reasons; while a cheaper area will either be not so nice, or poorly connected (or, if you are really unlucky, both). Similarly, there’s some nice and cheap, places, but you’ll spend half your life getting to somewhere interesting so might miss out on the London “experience”. Ultimately, you have to pick your favoured two out of the three!

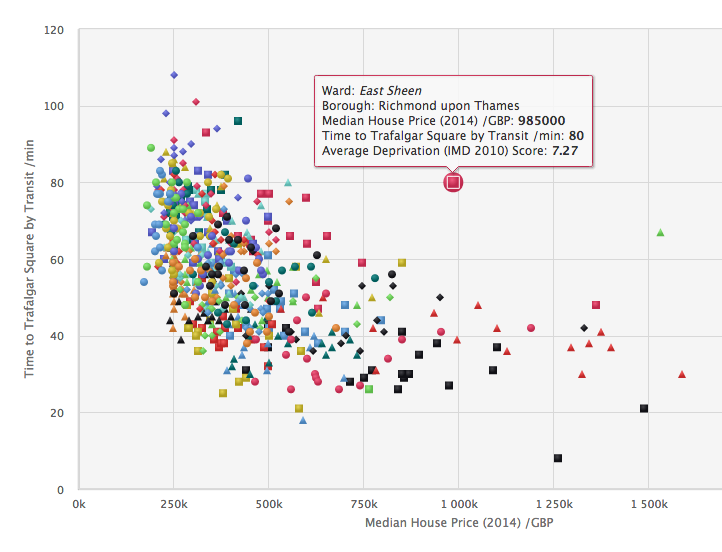
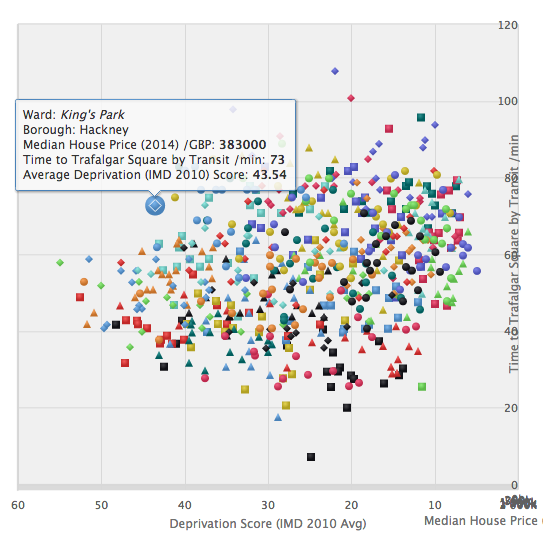
Is it really true that there is no magic place in London where all three factors score well? To see the possible correlations between these three factors, I’ve calculated the ward* averages for these, and have created a 3D plot, using High Charts. Have a look at the plot here. The “sweet” spot is point 0,0,0 (£0/house, 0 score for deprivation, 0 minutes to central) on the graph – this is at the bottom left as you first load it in.

Use your mouse to spin around the graph – this allows you to spot outliers more easily, and also collapse down one of the variables, so that you can compare the other two directly on a 2D graph. Unfortunately, you can’t spin the graph using touch (i.e. on a phone/tablet) however you can still see the tooltip popups when clicking/hovering on a ward. Click/touch on the borough names, to hide/show the boroughs concerned. Details on data sources and method used are on the graph’s page.

The curve away from the sweet spot shows that there is a reasonably good inverse correlation between house prices and deprivation, and house prices and nearness to the city centre. However, it also shows there is no correlation between deprivation and nearness. Newington is cheap and close in, but deprived. Havering Park is cheap and a nice area, but it takes ages to get in from there. The City of London is nice and close by – but very expensive. Other outliers include Merton Village which is very nice – but expensive and a long way out, while Norwood Green (Ealing) is deprived and far out (but cheap). Finally, Bishop’s in Lambeth is expensive and deprived – but at least it’s a short walk into the centre of London.

Try out the interactive graph and find the area you are destined to live in.

kingspark

p.s. If you are not sure where your ward is, try clicking on the blobs within your borough here.

* Wards are a good way to split up London – there are around 600 of them, which is a nice amount of granularity, and importantly they have real-world names, unlike the “purer” equivalent Middle Super Output Areas (MSOAs). Using postcode “outcodes” would be even better, as these are the most familiar “coded” way of distinguishing areas by non-statisticians, but statistical data isn’t often aggregated in this way.

Categories
BODMAS Conferences

UKDS Census Applications Conference

census1

I was in Manchester a couple of weeks ago for a UKDS conference on applications of the Census 2011 datasets that have been made available, through the ONS, NOMIS, UKDS and other organisations/projects. The conference was to celebrate the outputs and projects that have happened thus far, now that the Census itself is four years old and most of the main data releases have been made.

It was a good opportunity to present a talk on DataShine, which I made a little more technical than previously, focusing on the cartographical and technological decisions behind the design of the suite of websites.

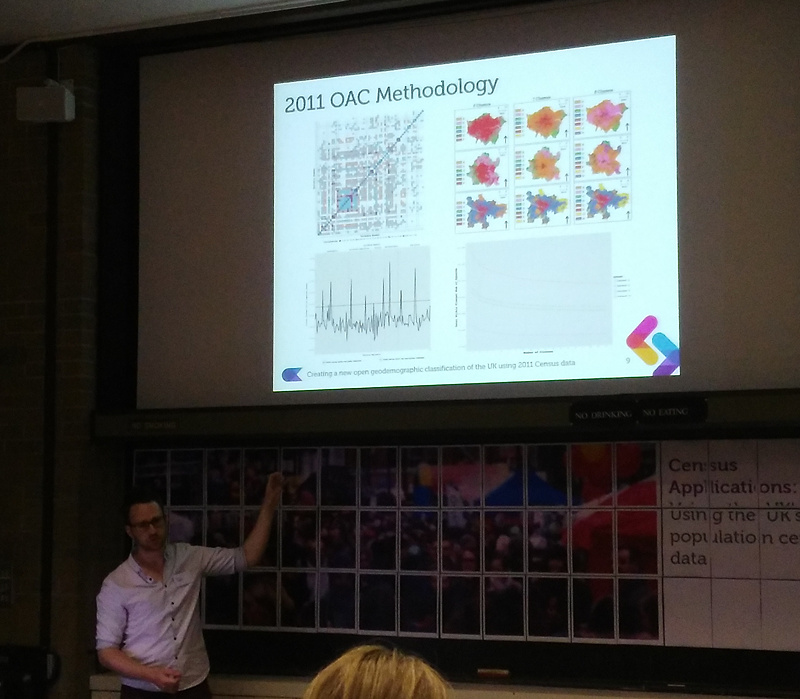
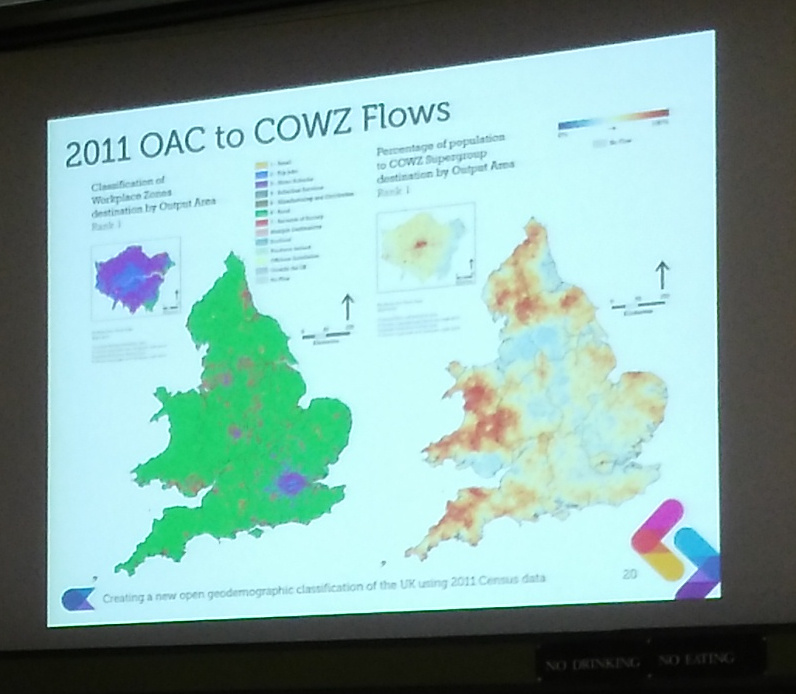
I enjoyed an interesting talk by Dr Chris Gale, outlining graphically the processes behind creating the 2011 OAC geodemographic classification. Chris’s code, which was open sourced, was recently used by the ONS to create a local-authority level classification. There was also some discussion towards the end of the two-day meeting on the 2021 Census, in particular whether it will happen (it almost certainly well) and what it will be like (similar to 2011 but focused on online responses to cut costs).

All-focus

After the conference close I had time to look around MOSI (the Museum of Science and Industry) which is mainly incorporated around an old railyard, terminus of the world’s oldest passenger railway and containing the world’s oldest station (opened in 1830, closed to passengers in 1844). But I was most impressed by the collection of airplanes in the adjoining hangar (once a lovely old market building), which included a Kamakaze. I also had a quick look around the Whitworth Gallery extension which has been nominated for this year’s Stirling Prize.

census3

Categories
Conferences

China: Fuzhou

fuzhou7

I spent a week in Fuzhou earlier in July, in China’s Fujian provice, presenting and attending a summer school and conference, respectively, at Fuzhou University. I’ve already blogged the conference itself (read it here) but during the week I got plenty of time, outside of the conference to get a feel for Fuzhou and this small part of China. Here are some notes:

fuzhou5

Bikesharing
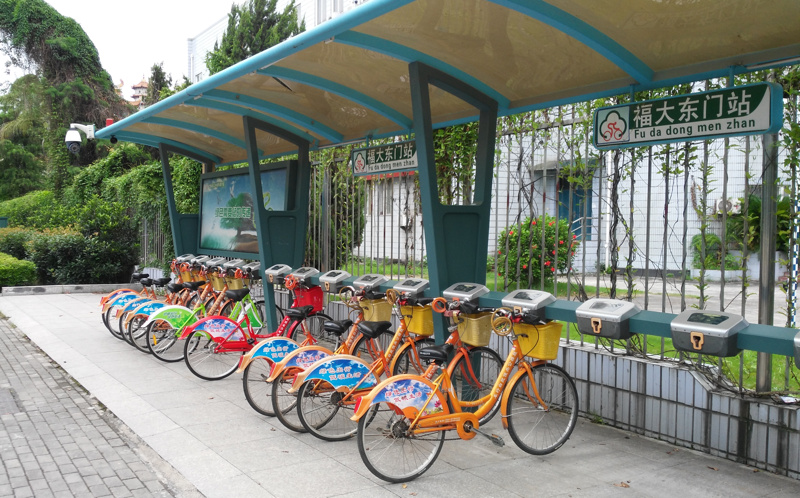
There is a bikeshare system in Fuzhou, but it is small (by Chinese standards). I saw a few bikeshare docking stations during my trip, in particular one outside the university, which was complete with a (closed) booth for an attendant (I think this is where you get a smartcard to operate it). Each station has 10-20 docks, generally nearly full of the bright orange and green bikes, docked under a bus-stop-style shelter that also contains an alarm light, CCTV and loudspeaker, and red scrolling LED information screen. Adjacent there were typically 10-20 further bikes chained together, presumably for manual restocking by the attendant when they are there. The one thing I did not see, at any point during the trip, was anyone actually using the bikeshare bikes. The modal share of cycling is low anyway in Fuzhou (the roads are intimidating, but this doesn’t stop the swarms of electric bike users) but I wasn’t expecting to see a completely unused bikeshare system in a country so famous for the transport mode.

fuzhou4

Transport in General
Fuzhou is a city of nearly five million people – half the size of London. And yet it has no metro, tram or commuter rail (apart from a couple of stations right on the outskirts). So everyone travels by car, taxi (very cheap – £1 for most journeys), bus (10p per journey, air-conditioned and frequent), or electric bike. Probably 50% car, 15% bus, 30% electric bike, 5% taxi. Walking is not so popular as the roads are generally very wide and difficult to cross (you don’t generally get much space given to you at zebra crossing!) and likely because of the hot climate at this time of the year. The one mode that I saw extremely little of, is pedal cycling. I had heard that cycling has quickly become an “uncool” thing to do in China, it is interesting to contrast with the rapidly rising cycling use in London – albeit from a low base. London’s cycling mode share was also once much higher and also had a sharp fall – maybe London is just ahead of hte curve.

fuzhou3

Climate and Pollution
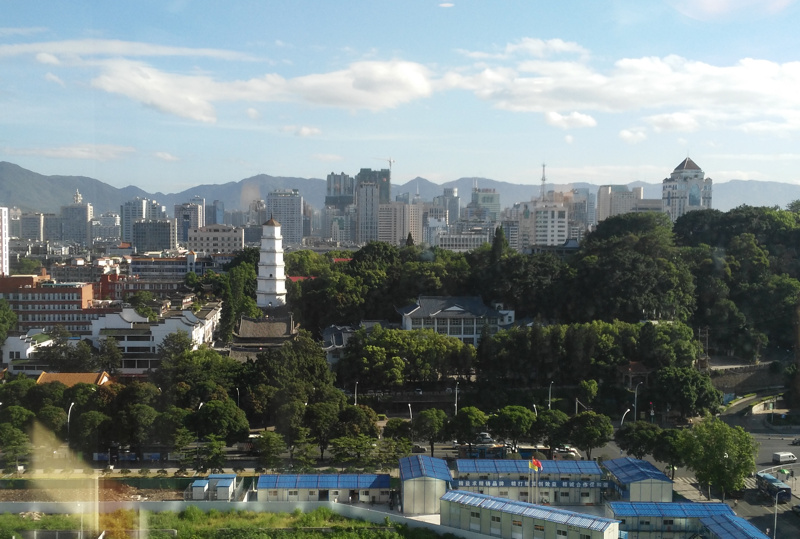
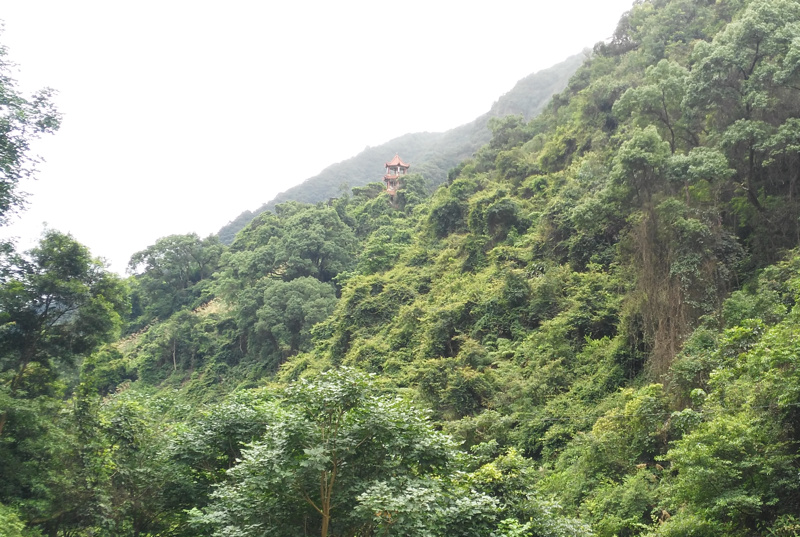
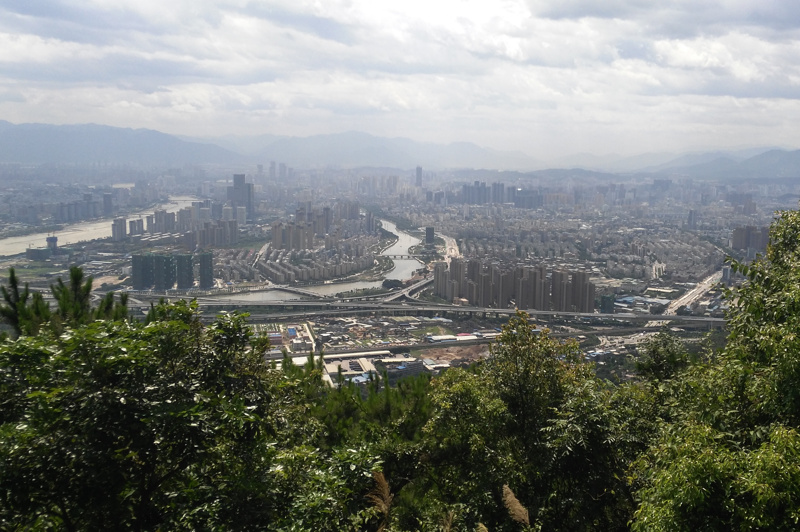
Fuzhou is a southern Chinese city. It’s around an hour’s drive in from the coast, where its airport is. It’s north of the many cities near Hong Kong – about 90 minutes on a plan from the latter – but south of Shanghai, and a long way south from Beijing. The climate is therefore quite hot and muggy at this time of year. As you might expect from a city of five million people where most people drive, a haze of pollution was often visible where I was there. However, the haze is not too bad. Fuzhou is helped in this by being surrounded on most sides by thickly forested mountains, which often rise up steeply, immediately beyond the city limits. One of these ranges indeed forms the Fuzhou National Forest Park which contains a wide variety of trees, including a 1000-year old tree with its elderly branches supported by concrete pillars! The masses of trees on all sides no doubt help with some soaking up of pollutants. Many of the large roads have lines of thickly foliaged trees running along them, and the bridges for pedestrian crossings, and highway flyovers, also have lines of shrubs and bushes all the way along them, which doubtless also help absorb pollutants and keep the haze under control. The street foliage also has the side effect of making many views of the city look quite pretty, with lines of green and purple plants softening the concrete structures and making the city seem to blend into the landscape.

fuzhou1

Urban Structure
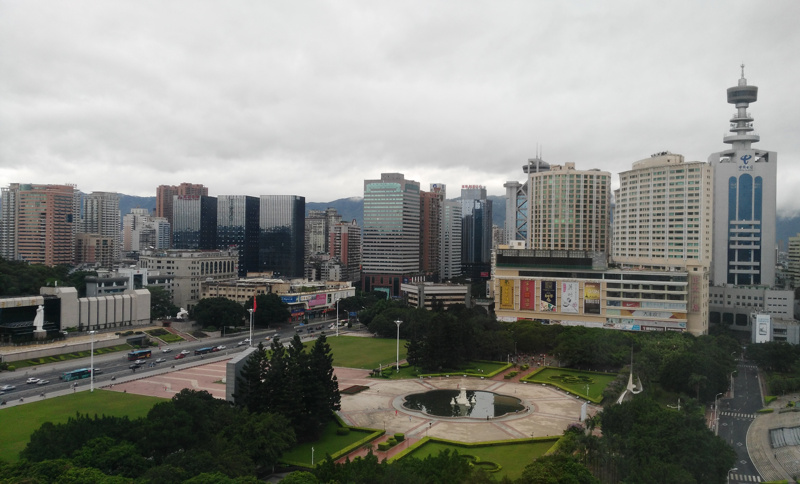
Fuzhou is a city largely of apartment blocks. Strikingly, the centre of the city has virtually no construction going on – it is as dense it as needs to be, Fuzhou’s population does not need to increase, and the congestion need not get any worse. A few from the central hotel reveals almost no cranes, anywhere on the horizon, apart from some small ones for the aforementioned metro construction project. This is starkly different to the edges of the city, at the few gaps between the mountains, particularly along the road leading to the airport and the coast. There is a brand-new high-speed railway station at this edge of the city, and it also is the direction towards the shipbuilding and electronics industry factories that are a few miles distant. The area around the station is relatively free of apartment buildings, but huge numbers are currently being built, many 30-40 stories high and often built very close to each other, in clusters with distinct designs. The new station and the good road leading outwards it presumably the spur. This is infrastructure building, and developers responding to this, on a grand scale.

fuzhou6

Consumer Culture
One thing I noticed was that most of the Chinese attendees of the conference I was at had iPhone 6 phones. I’m not sure if this is representative of the Fuzhou population at large, but I was surprised to see no Huawei or Xiomai phones (both Chinese brands, i.e. home-grown). I have a Huawei myself – it is excellently built and I am very happy with it. Apple has done hugely well out of convincing people to pay thousands of extra yuan for the a phone with the Apple branding. Talking about luxury brands in general, Fuzhou has a cluster of these (Christian Dior etc) in a small mall in the centre, and also I spotted a Starbucks and McDonalds lurking nearby. But, Apple aside, in general western brands have little impact. And as for the popularity of the iPhone, the (official) Apple Stores have not made it to Fuzhou yet.

More generally, the food in China takes some getting used to, both the variety of produce and also the local varients. Lychee trees are everywhere (the region is where they were originally from) and there were plenty of other unusual fruits. The look of lychees takes some getting used to, but the taste is very pleasant. Fish features in a lot of dishes, as do various meats – the buffet and “lazy Susan” format though thankfully means the more mysterious items can be ignored! Our host also took us to an upscale restaurant where we had a lot of very spicy food (rare for the region) and also some weak but pleasant Chinese beers.

fuzhou2

Categories
London OpenStreetMap

OpenStreetMap: London Building Coverage

osm_londondetail

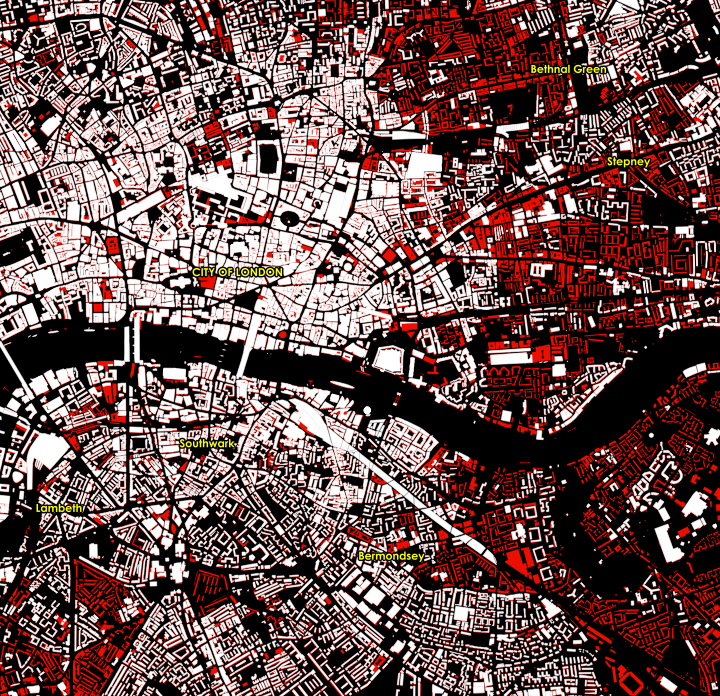
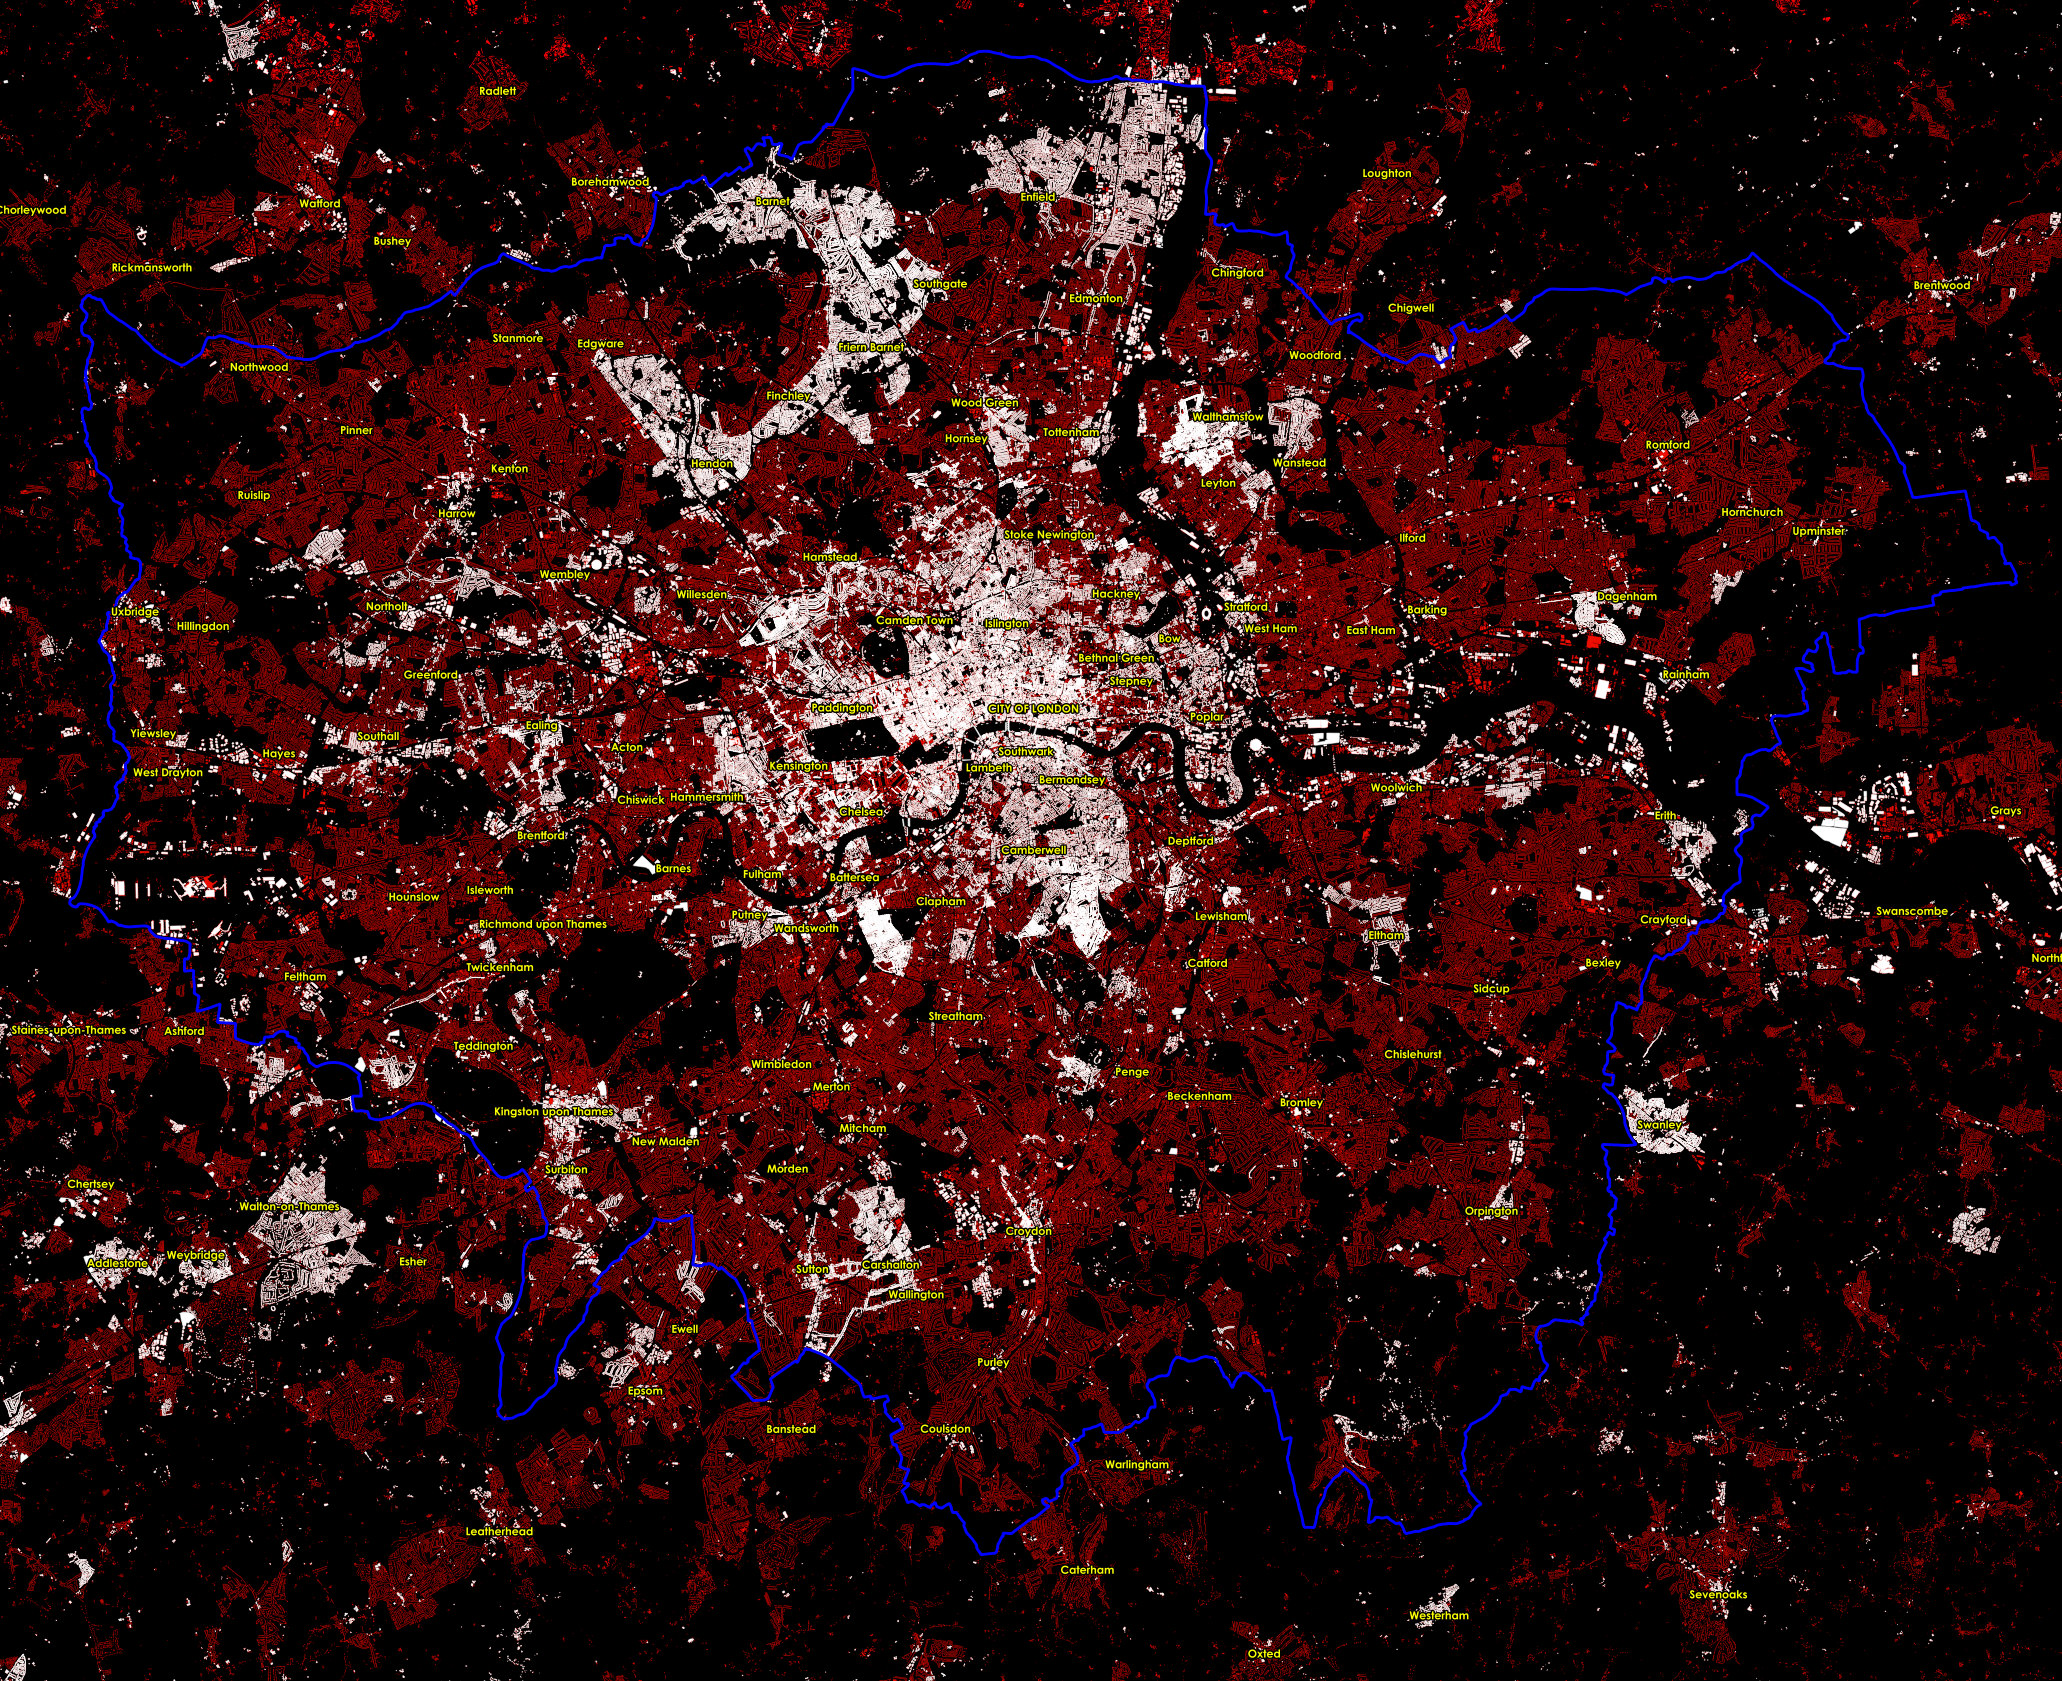
OpenStreetMap is still surprisingly incomplete when it comes to showing buildings for the London area, this is a real contrast to other places (e.g. Birmingham, New York City, Paris) when it comes to completeness of buildings, this is despite some good datasets (e.g Ordnance Survey OpenMap Local) including building outlines. It’s one reason why I used Ordnance Survey data (the Vector Map District product) rather than OpenStreetMap data for my North/South print.

The map below (click to view a larger version with readable labels and crisper detail, you may need to click it twice if your browser resizes it), and the extract above, show OpenStreetMap buildings in white, overlaid on OS OpenMap Local buildings, from the recent (March 2015) release, in red. The Greater London boundary is in blue. I’ve included the Multipolygon buildings (stored as relations in the OSM database), extracting them direct from OpenStreetMap using Overpass Turbo. The rest of the OSM buildings come via the QGIS OpenStreetMap plugin. The labels also come from OS OpenMap Local, which slightly concerningly for our National Mapping Agency, misspells Hampstead.

The spotty nature of the OSM coverage reveals individual contributions. For example, Swanley in the far south east of the map is comprehensively mapped, thanks presumably due to an enthusiastic local. West Clapham is also well mapped (it looks like a small-area bulk import here from OpenMap) but east Clapham is looking sparse. Sometimes, OpenStreetMap is better – often, the detail of the buildings that are mapped exceeds OpenMap’s. There are also a few cases where OSM correctly doesn’t map buildings which have been recently knocked down but the destruction hasn’t made it through to OpenMap yet, which typically can have a lag of a year. For example, the Heygate Estate in Elephant & Castle is now gone.

The relative lack of completeness of building data in OpenStreetMap, for London, where the project began in 2004, is – in fact – likely due to it being where the project began. London has always an active community, and it drew many of the capital’s roads and quite a few key buildings, long before most other cities were nearly as complete. As a result, when the Bing aerial imagery and official open datasets of building outlines became more recently available, mainly around 2010, there was a reluctance to use these newer tools to go over areas that had already been mapped. Bulk importing such data is a no-no if it means disturbing someone’s prior manual work, and updating and correcting an already mapped area (where the roads, at least, are drawn) is a lot less glamorous than adding in features to a blank canvas. As a result, London is only slowly gaining its buildings on OSM while other cities jumped ahead. Its size doesn’t help either – the city is a low density city and it has huge expanses of low, not particularly glamorous buildings.

An couple of OpenStreetMap indoor tracing parties might be all that’s needed to fix this and get London into shape. Then the OpenStreetMap jigsaw will look even more awesome.

osm_london_2mb

Click for a larger version. Data Copyright OpenStreetMap contributors (ODbL) and Crown Copyright and Database Right Ordnance Survey (OGL).

Categories
BODMAS Data Graphics London

The City of London Commute

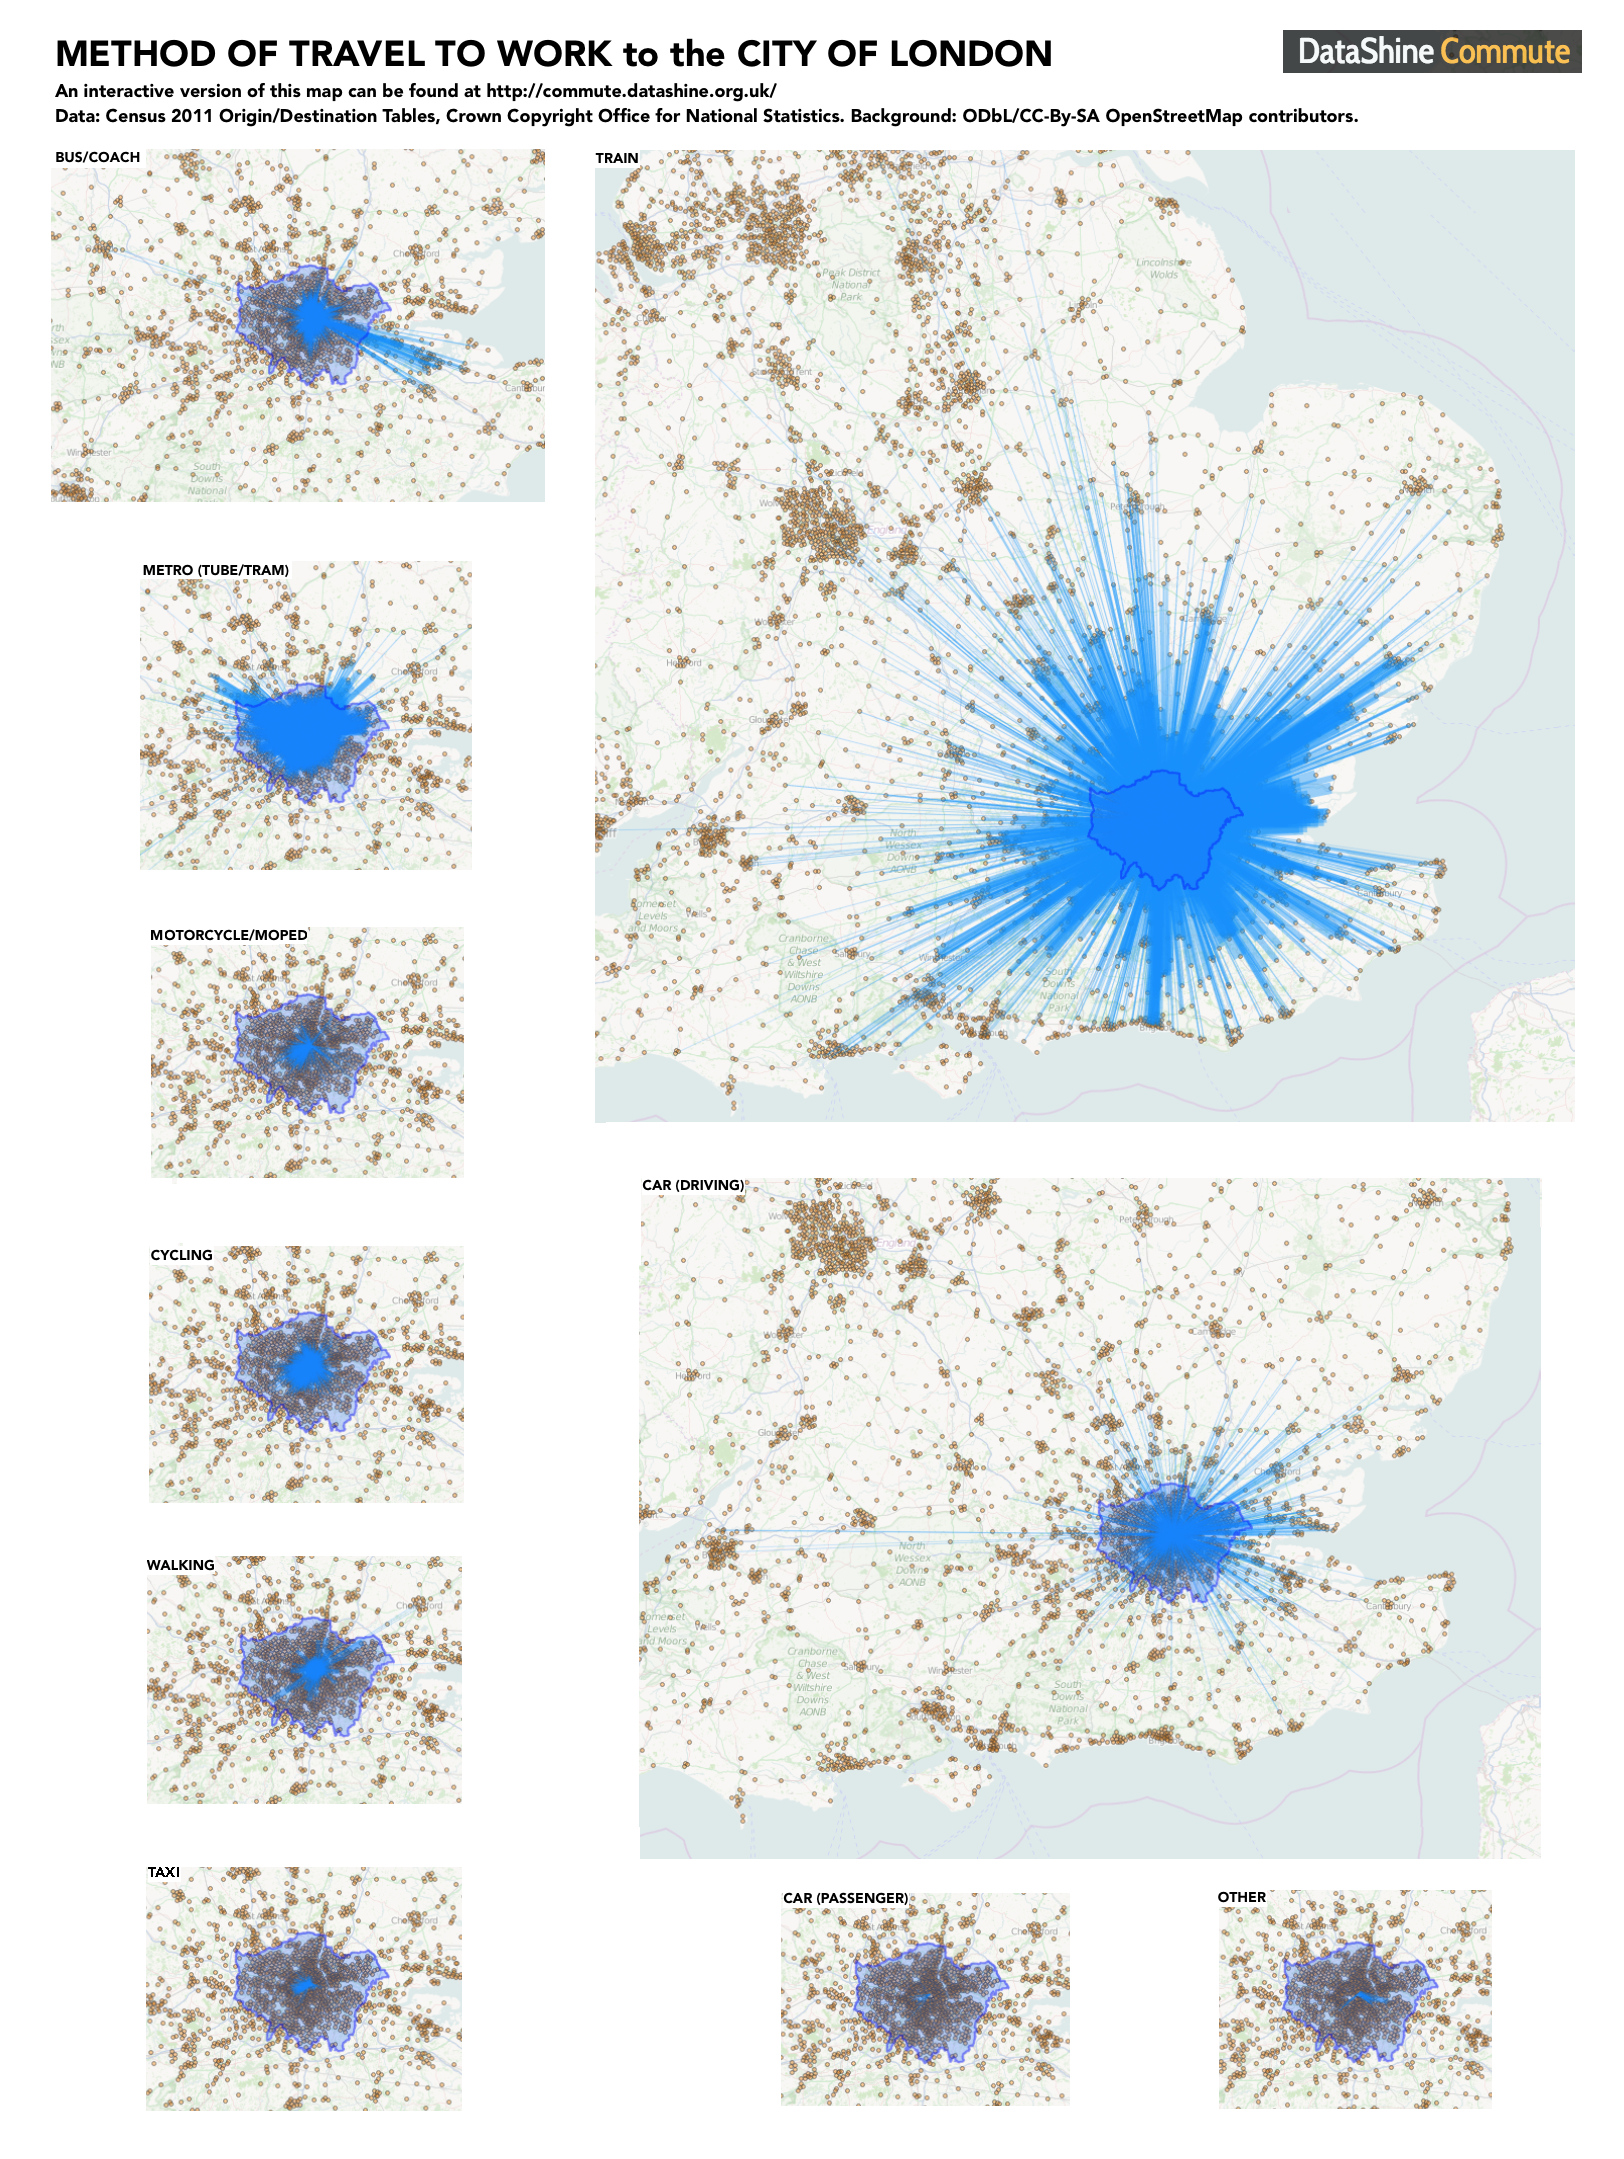
Here’s a graphic I’ve made by taking a number of screenshots of DataShine Commute graphics, showing the different methods of travelling to work in the City of London, that is, the Square Mile area at the heart of London where hundreds of thousands and financial and other employees work.

All the maps are to the same scale and the thickness of the commuting blue lines, which represent the volume of commuters travelling between each home area and the City, are directly comparable across the maps (allowing for the fact that the translucent lines are superimposed on each other in many areas). I have superimposed the outline of the Greater London Authority area, of which the City of London is just a small part at the centre.

ttwf_cityoflondon

There’s lots of interesting patterns. Commuter rail dominates, followed by driving. Car passenger commutes are negligible. The biggest single flow in by train is not from another area of London, but from part of Brentwood in Essex. Taxi flows into the City mainly come from the west of Zone 1 (Mayfair, etc). Cyclists come from all directions, but particularly from the north/north-east. Motorbikes and mopeds, however, mainly come from the south-west (Fulham). The tube flow is from North London mainly, but that’s because that’s where the tubes are. Finally, the bus/coach graphic shows both good use throughout inner-city London (Zones 1-3) but also special commuter coaches that serve the Medway towns in Kent, as well as in Harlow and Oxford. “Other” shows a strong flow from the east – likely commuters getting into work by using the Thames Clipper services from Greenwich and the Isle of Dogs.

Try it out for your own area – click on a dot to see the flows. There is also a Scotland version although only for between local authorities, for now.

Click on the graphic above for a larger version. DataShine is part of the ESRC-funded BODMAS project at UCL. I’ll be talking about this map at the UKDS Census Applications conference tomorrow in Manchester.

Categories
Conferences

China: ICSDM Conference

IMG_20150706_163812ec

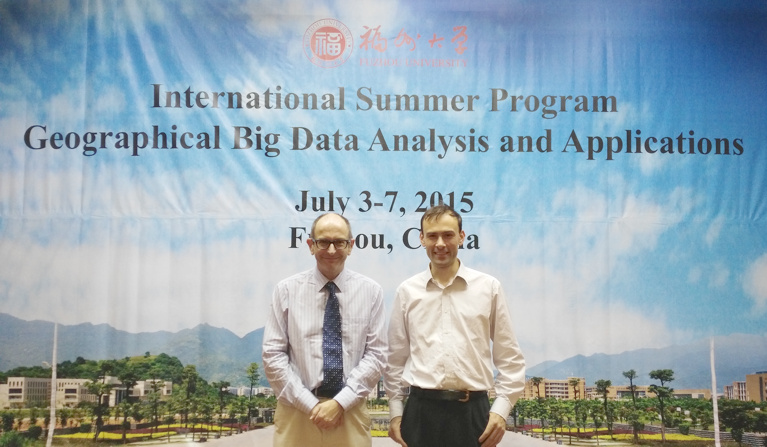
Last week I was in China for the 2nd IEEE International Conference on Spatial Data Mining (ICSDM), travelling with my lab’s director who was keynoting and giving a day’s teaching at the conference’s accompanying summer school. The conference was based in Fuzhou University, on the western edge of Fuzhou in Fujian Province, a city of five million people about 90 minutes north east of Hong Kong by plane, and an hour’s drive inland from the ocean. The city’s setting is rather dramatic – it is surrounded by forested mountains, and the greenery extends into the city too, where it helps absorb pollution.

IMG_20150709_165709ecThe conference consisted of a number of keynote presentations given by domain experts on topics such as Big Models for Big Data, to Social Media geographic data mining and classification, to multi-source pollution monitoring and modelling. Interspersed with the keynotes were parallel tracks of project presentations, many (but not all) of which were given by Ph.D. candidates and other students at various universities elsewhere in China, as well as at Fuzhou itself. Remote sensing was a major theme of the conference, but other topics included modelling house prices based on demographic information and looking at movements of people using the Chinese equivalents of Facebook and Twitter.
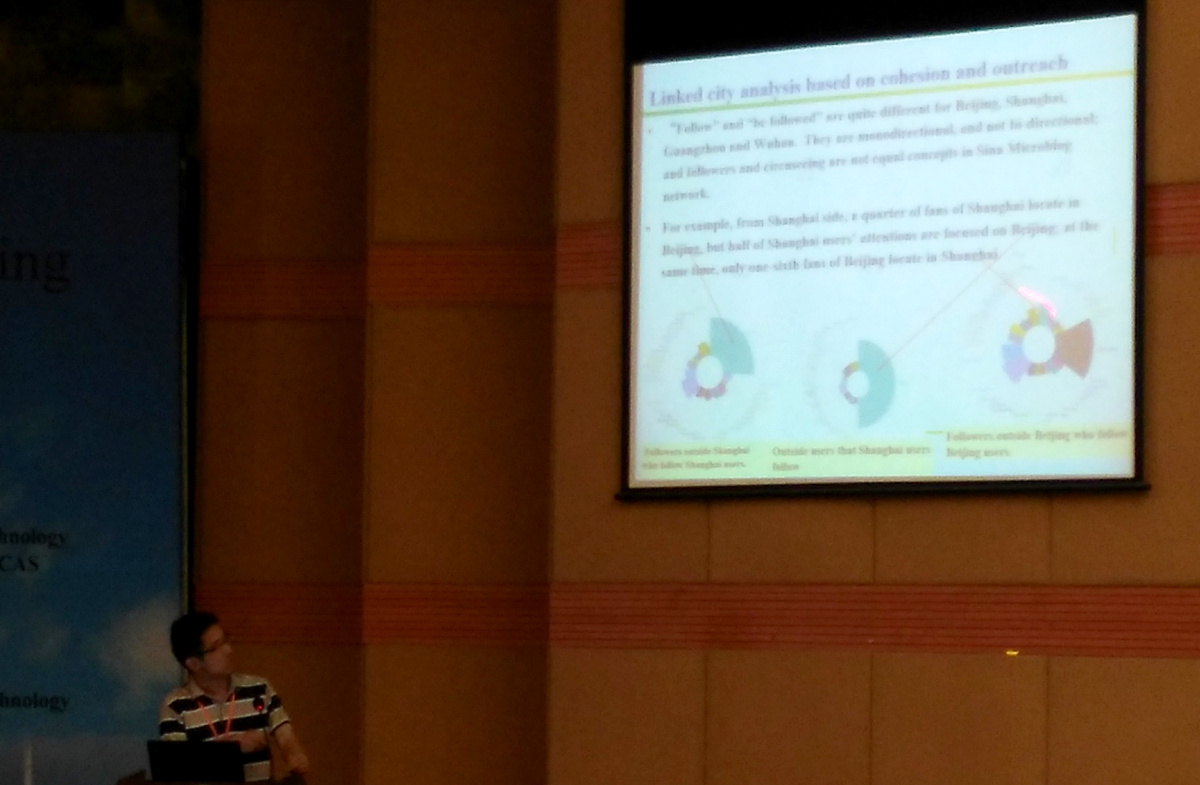
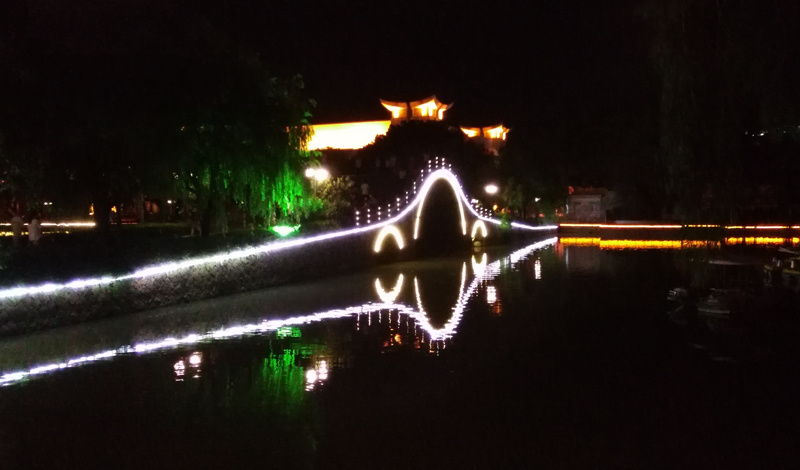
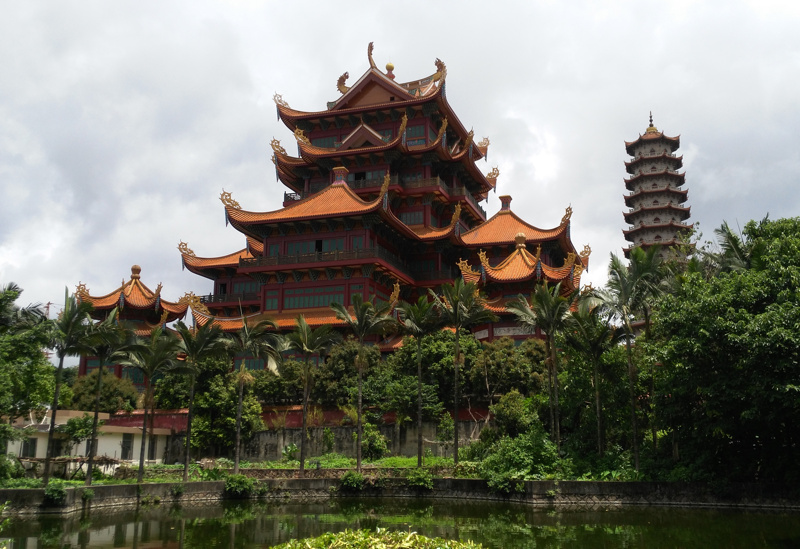
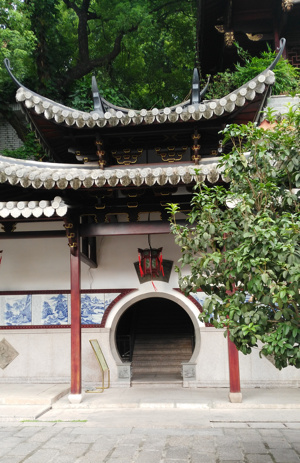
As well as the conference itself there was time for a number of walks in the local forest parks and up some mountains – tough in the heat and humidity of southern China in the summer, but well worth it for the views. We also visited a number of temple buildings and other areas popular with tourists.

It was a well organised conference and was interesting to attend – not least to see that the sorts of research topics that we are familiar with here in quantitative geography at UCL, are carried out in China too – but with a local perspective, based on the different datasets available and cultural habits. The keynote talks also added a good, rounded perspective on the spatial data mining field as it currently stands. All in all, an eye-opening week.

All-focus

Categories
Data Graphics London Mashups OpenLayers OpenStreetMap

Tube Line Closure Map

anim

[Updated] The Tube Line Closure Map accesses Transport for London’s REST API for line disruption information (both live and planned) and uses the information there to animate a geographical vector map of the network, showing closed sections as lines flashing dots, with solid lines for unaffected parts. The idea is similar to TfL’s official disruption map, however the official one just colours in the disrupted links while greying out the working lines (or vice versa) which I think is less intuitive. My solution preserves the familiar line colours for both working and closed sections.

My inspiration was the New York City MTA’s Weekender disruptions map, because this also blinks things to alert the viewer to problems – in this case it blinks stations which are specially closed. Conversely the MTA’s Weekender maps is actually a Beck-style (or actually Vignelli) schematic whereas the regular MTA map is pseudo-geographical. I’ve gone the other way, my idea being that using a geographical map rather than an abstract schematic allows people to see walking routes and other alternatives, if their regular line is closed.

Technical details: I extended my OpenStreetMap-based network map, breaking it up so that every link between stations is treated separately, this allows the links to be referenced using the official station codes. Sequences of codes are supplied by the TfL API to indicate closed sections, and by comparing these sequences with the link codes, I can create a map that dynamically changes its look with the supplied data. The distruption data is pulled in via JQuery AJAX, and OpenLayers 3 is used to restyle the lines appropriately.

Unfortunately TfL’s feed doesn’t include station closure information – or rather, it does, but is not granular enough (i.e. it’s not on a line-by-line basis) or incorrect (Tufnell Park is shown only as “Part Closed” in the API, whereas it is properly closed for the next few months) – so I’m only showing line closures, not station closures. (I am now showing these, by doing free-text search in the description field for “is closed” and “be closed”.) One other interesting benefit of the map is it allows me to see that there are quite a lot of mistakes in TfL’s own feed – generally the map shows sections open that they are reporting as closed. There’s also a few quirks, e.g. the Waterloo & City Line is always shown as disrupted on Sundays (it has no Sunday service anyway) whereas the “Rominster” Line in the far eastern part of the network, which also has no Sunday service, is always shown as available. [Update – another quirk is the Goblin Line closure is not included, so I’ve had to add that in manually.]

Try it out

Categories
Orienteering

OOMap 2.4 – Add Plaques from Open Plaques

oomv24

OpenOrienteeringMap can now automatically import the locations and details, of public plaques, as suggested controls, into the area where you are creating a map. The service uses the API from Open Plaques, which is a global open-source database of public plaques. In the London, the most commonly known plaques are the “Blue Plaques“, which are put up by English Heritage and typically mark the houses where the great and good of times past live. However, there are many other types and colours of plaques which are also recorded in the database and accessible now on OpenOrienteeringMap. Thanks to Jez and the team at Open Plaques for building a comprehensive open database, with a fast and flexible API to access it. Once you’ve placed your map, just click “Add Plaques” and a control will be created to represent each plaque. The locations are sometimes imprecise so ground-truthing is always recommended.

If you discover plaques that are not in Open Plaques, then please add them to the project so that OOM and other services can benefit from the extra data. Additionally, if you discover more accurate locations for plaques, you can update Open Plaque with this information. If you take photos, add them to Flickr or WikiCommons, tagging with their Open Plaques ID to link each photo to its corresponding record.

The functionality is similar to importing postboxes, another popular control type for informal Street-O events, which was added in v2.3, except that the plaques are available across the global and other editions of OpenOrienteeringMap, as well as the UK edition. However, please note that, at the time of writing, plaques have been most widely recorded in the UK, USA and Germany, each of which has over 5000 plaques. Other countries have (a lot) fewer, so you are likely to see a “no plaques available” message when you try and import them in to places in other countries, except perhaps in the centre of major cities.

Also for v2.4 I’m using newer versions of the JQuery and JQuery-UI libraries, and have slightly tweaked the user interface for the new Plaques button. The paper orientation toggle also now has some nice logos, and some bugs relating to tip display have been fixed.

Try it out now. As ever, OpenOrienteeringMap is completely free to use, if you find it useful for your event, and it saved a lot of time for you or your club mapper, then feel free to tip, see the links in the pink box.

(N.B. The full plaque text is used as the control description, so this should be edited and partially removed, should you use the automated clue sheet option in OpenOrienteeringMap, so that the competitor has to prove they are there by writing an appropriate part of the text.)

stratford_plaque