In the first post in a mini-series, I looked at how High Speed 2 is impacting West Ruislip and Ickenham. In this second piece, I move slightly west, to look at the Colne Valley Viaduct. At 2.2 miles long, this will be one of the biggest structures on the entire line. The viaduct is what carries the line away from the existing Chiltern Line it has been sitting beside, and outside of London altogther, into the Chiltern Hills. As a symbol of leaving/arriving in the capital, and the scenic nature of the valley it crosses, the Colne Valley Viaduct has the potential to be a “tourist attraction” of the railway – both for the people on it, and also users of the natural park that sits underneath it.
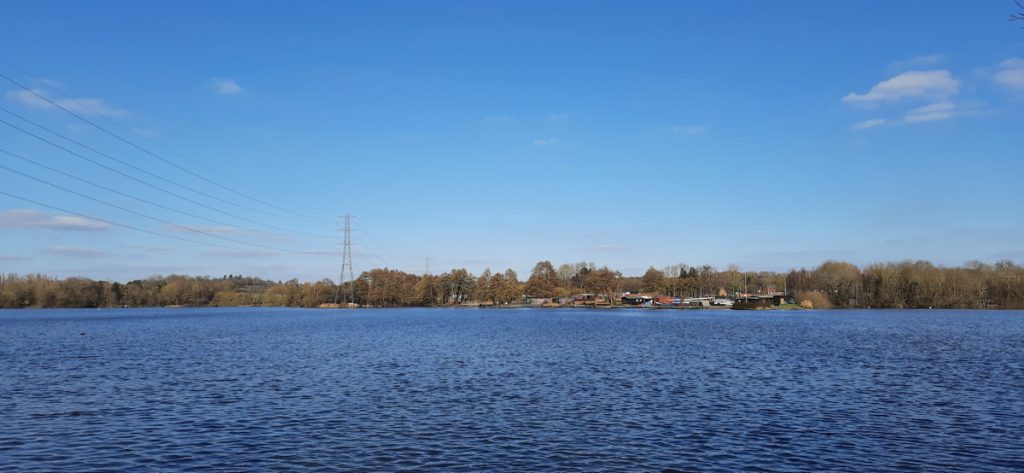
The Colne Valley is a very “wet” valley – it was extensively mined for gravel, and as a result there are numerous lakes. The viaduct crosses a number of these, as well as clipping some natural woodland that has gradually built up. A slight planned route change (moving the curve around 100m north) since the initial plans a few years ago, has resulting in less ancient woodland being destroyed, but the line does still pass close to a number of nature reserves, including through one – Broadwater Lake Nature Reserve – that it has unfortunately closed for many years, and outdoor leisure facilities (two of which are in the process of moving).
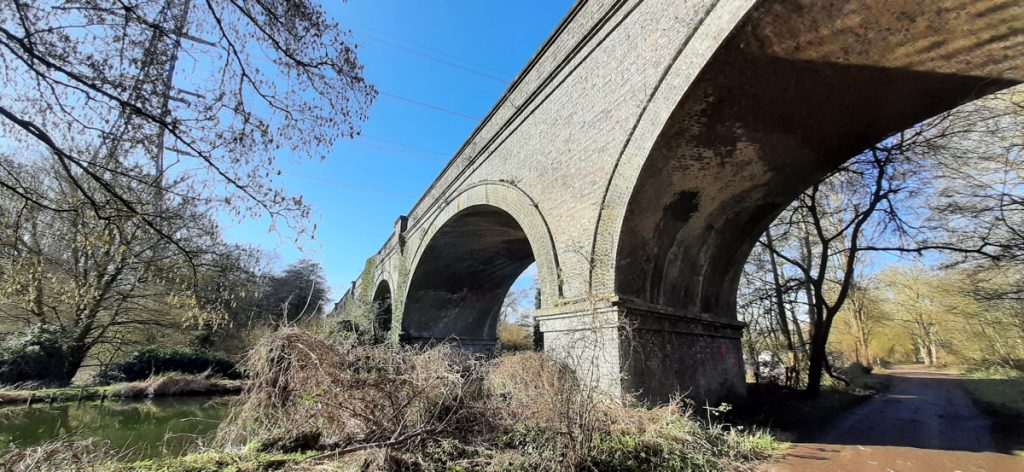
It’s not the only railway viaduct in the valley, here’s the Chiltern Main Line viaduct just to the south – incidentally the electricity pylon here will be going soon as part of a power rerouting for the new viaduct, so this particular view will improve soon:
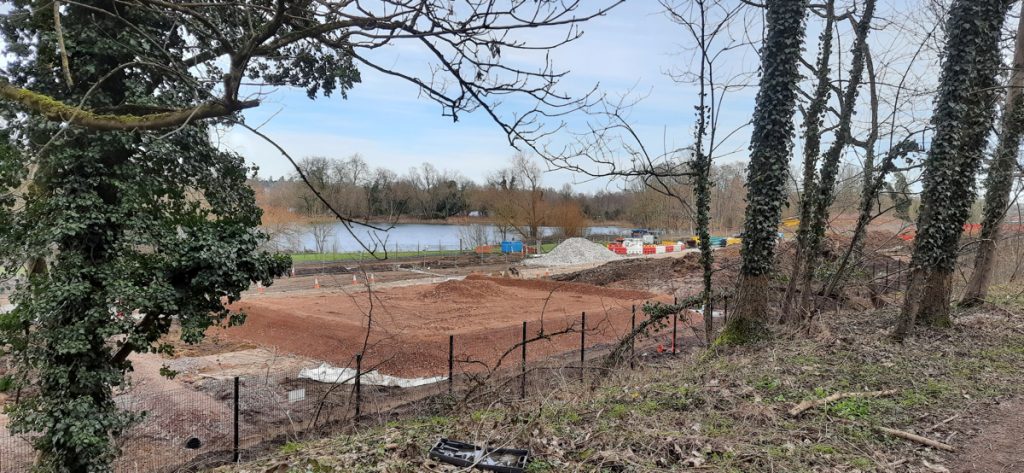
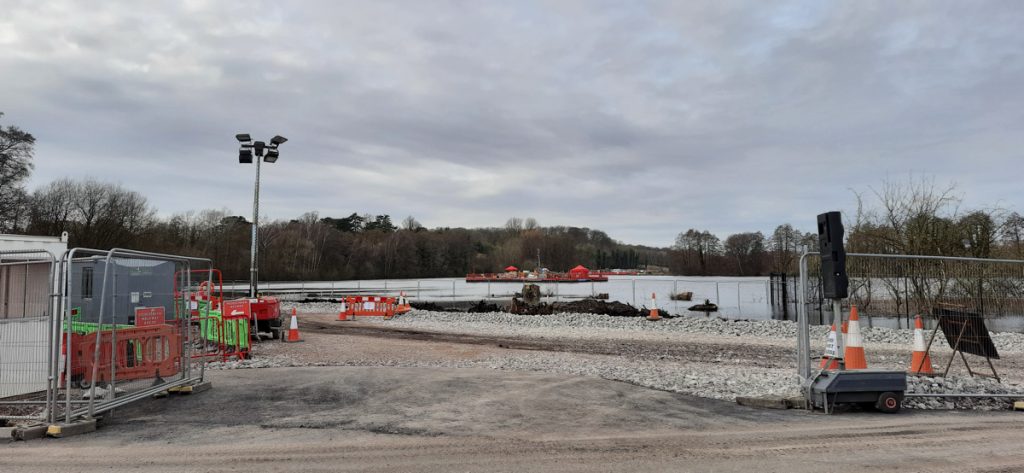
Piling for the piers of the viaduct begins this month and is set to take a number of years, the work moving from west to east, with haul roads currently being built underneath the viaduct. The concrete structures are being built on site. The haul roads will build out from each end, meeting either side of the Grand Union Canal. This break will mean as short as possible a closure for the canal itself – it will only need to close when the deck building girder is directly above it.
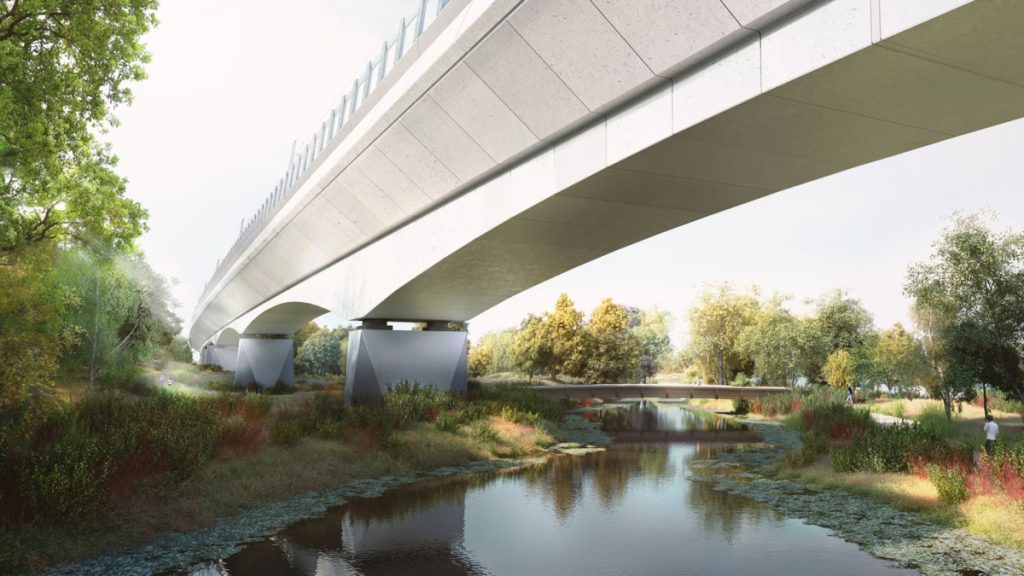
The large, curving and highly visible nature of the viaduct has meant that it has been possible to justify creating a design for it that is not just a simple set of vertical piers. Instead, sweeping arches will carry the line through the woodlands and across the waterways and lakes.
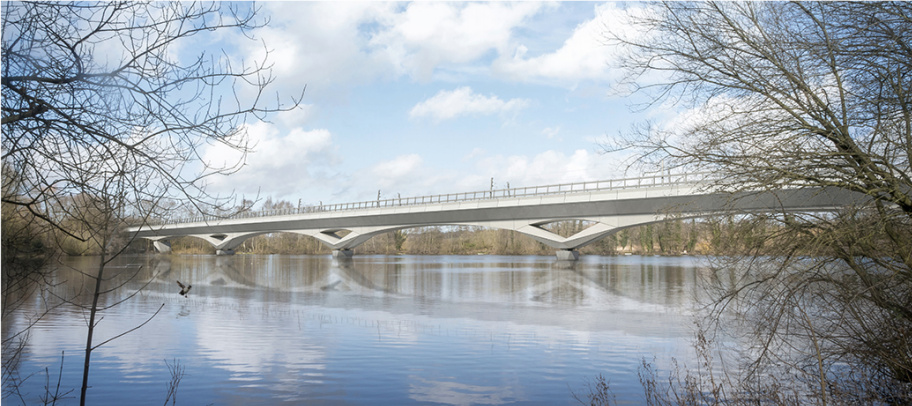
The viaduct will have sound barriers but they will mostly be transparent, except for the section facing a new housing development at Denham Film Studios, so that passengers will be able to enjoy the extensive views across the lakes at ~200mph. At this speed, it will take less than a minute to complete cross the valley on the viaduct. As the viaduct is “bookended” by long tunnels at either end, it will be the most obvious visual clue to south-bound passengers that they are about to arrive in London.
From west to east, the main crossings and affected waterways and buildings are:
- Old Shire Lane, a bridleway that also forms the Hertfordshire/Buckinghamshire border. It is currently closed. It will be diverted in a loop to pass under the start of the viaduct. It is due to reopen in towards the end of 2021. A diversion route is further south, via Wyatt’s Covert.
- The A412 North Orbital Road. An unpleasant, fast road, which is made even worse at the moment by high dust levels and HS2 construction trucks.
- A narrow strip of woodland beside a lake, and the Denham Waterski clubhouse, which is about to be demolished and has a brand new replacement on the opposite shore.
- Battlesford Wood, just north of Denham Film Studios.
- The River Colne, which will be rerouted slightly here to flow more perpendicularly between two piers of the viaduct. A bridge will also be built here, to connect Battlesford Wood and a new path under the viaduct to the A412 and Wyatt’s Covert, to a nature reserve and Moorhall Road.
- Almost the full length of Long Pond (called Long Lake on some maps).
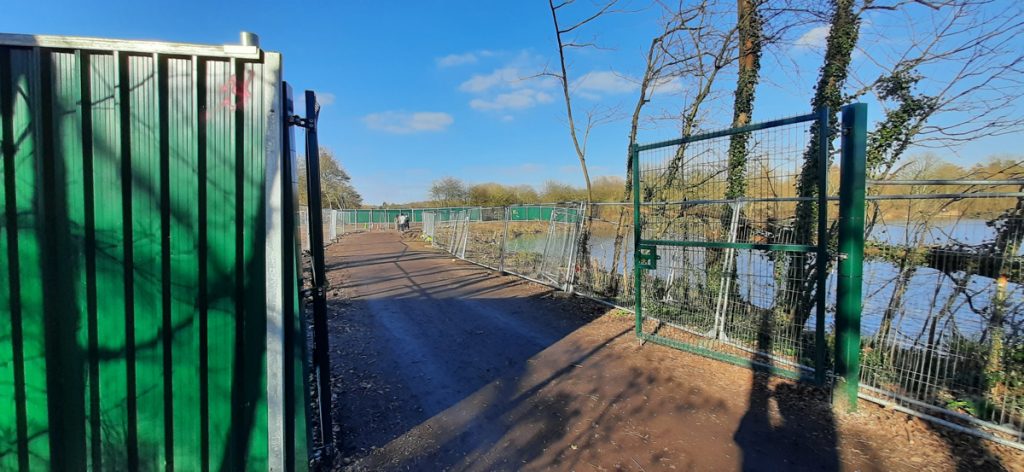
- A narrow nature reserve, Broadwater Lake Nature Reserve, which is unfortunately closed for the duration of HS2 construction but will have improved access links afterwards (see above).
- Korda Lake – HS2 goes diagonally right across this fishing lake.
- Moorhall Road, which goes between Denham Green and South Harefield.
- A corner of Savay Lake.
- The Grand Union Canal and towpath. A new pier on to Savay Lake will be built here, opening up a view.
- A track just east of the canal, that forms National Cycle Route 6.
- Diagonally right across Harefield No. 2 lake.
- Under a line of pylons that is getting rerouted further east, as it will be too close to the viaduct structure.
- Right over the top of Hillingdon Outdoor Activity Centre, which is also closing and moving to an as yet announced location.
- The viaduct finally touches down in fields just before Harvil Road.
For the last piece in this mini-series, I focus on the huge worksite for both this viaduct and also the Chiltern Tunnels – the Colne Valley Western Slopes.