Categories
OpenLayers Technical

GeoComputation: A Practical Primer

geocomputationGeoComputation: A Practical Primer, edited by Profs Chris Brunsdon and Alex Singleton, has just been published by SAGE.

The book acts both as a reference guide to the field and as a guide to help you get to know aspects of it. Each chapter includes a worked example with step-by-step instructions.

Each chapter has a different author, and includes topics such as spatial data visualisation with R, agent-based modelling, kernel density estimation, spatial interaction models and the Python Spatial Analysis library, PySAL. With 18 chapters, the book runs to over 300 pages and so has the appropriate depth to cover a diverse, active and fast-evolving field.

I wrote a chapter in the book, on open source GIS. I focused particularly on QGIS, as well as mentioning PostGIS, Leaflet, OpenLayers (2) and other parts of the modern open source “geostack”. My worked example describes how to build a map, in QGIS, of London’s railway “not-spots” – places which are further than a mile from a railway station, using open data map files, mainly from the Ordnance Survey. With the guide, you can create a map like the one below:

offthetracks

That little spot on its own in central-ish London, by the way, is part of Burgess Park, near Peckham.

The book has only just been published and I was able to slip in brand new screenshots (and slightly updated instructions) just before publication, as QGIS 2.6 came out late last year. So, the book is right up to date, and as such now is a great time to get your copy!

It’s available now in paperback on Amazon: Geocomputation: A Practical Primer.

The first part of my chapter:

geocomp_ch17

Categories
Technical

Quick-and-Dirty WordPress Site Cloning

mysqlcloning

Here is a guide to clone a WordPress(.org) blog, on the same server, 10 steps, on Linux, You’ll definitely need admin access to the blog itself, and probably to the database and server too, depending on your setup. I did this recently as I needed a copy of an existing production site, to hack on. If you don’t fancy doing it the quick-and-dirty way, there are, I’m sure, even quicker (and cleaner) ways, by installing plugins.

In the following instructions, substitute X and Y for your existing and new blog, respectively.

0. Do a backup of your current website, like you do normally for an upgrade or archiving, in case anything goes wrong. e.g. under Tools > Export in the WordPress admin interface.

1. Copy all the files:
cp -r /home/~username/www/blog_X /home/~username/www/blog_Y

2. Edit wp-config.php in your new blog directory:

Change:
$table_prefix = 'wp_X_';
to:
$table_prefix = 'wp_Y_';

3. Copy all the database tables (prefixed with wp_X_). The new ones should have a prefix wp_Y_ instead. I used the Copy functionality under the Operations tab in phpMyAdmin (see screenshot below).

4. Edit wp_Y_options:
update wp_Y_options set option_name = 'wp_Y_user_role' where option_name = ' wp_X_user_role';

5. Edit wp_Y_options:
Edit the option_value for rows with option_name values of siteurl and home, pointing them to the new location – mine are the same but one might be different, e.g. if you have your WordPress core files in a subdirectory relative to the directory for the site entry-point on the web.

update wp_Y_options set option_value = 'http://your_server.com/~username/wp_Y' where option_name = 'siteurl';
update wp_Y_options set option_value = 'http://your_server.com/~username/wp_Y' where option_name = 'home';

There may be other rows referencing your old blog name, but these are probably from plugins and therefore probably don’t need to be changed.

6. Edit wp_Y_usermeta:
update wp_Y_usermeta set meta_key = replace(meta_key, 'wp_X', 'wp_Y');

(You can edit the affected rows manually, but I had a lot to do – there’s around 5 for each user.)

7. Drop force-upgrade.php in the same directory as wp-config.php and run it from your browser. This rebuilds caches/hashes stored in some of the tables. You can run it repeatedly if necessary, (e.g. if you missed a step above), it shouldn’t do any harm.

You can find force-upgrade.php here.

8. Delete force-upgrade.php. Leaving it is a security risk.

9. Log in to your blog in the new location, as normal. Usernames and passwords should be preserved.

mysqlcopy

Categories
Technical

OpenLayers 3 and Vector Data

As part of a project to move most of my OpenLayers 2-powered websites to OpenLayers 3, I have recently converted two more – DataShine: Travel to Work Flows and the North/South Interactive Map. Unlike the main DataShine: Census website, both of these newer conversions include vector geospatial data, so there was additional learning involved during the migration process, mainly relating to vector styling.

northsouth2North/South Interactive Map

For the North/South Interactive Map, I made use of the loading in of remote GeoJSON files.

Vector Layers

Here’s a vector layer:

layerPoints = new ol.layer.Vector({
    source: pointSource,
    style: function(feature, res) { return pointStyle(feature, res); }
});

The pointSource is a ol.source.GeoJSON, which requires the projection of the files to be defined, as well as that to be displayed, when defining the source for the Vector layer:
pointSource = new ol.source.GeoJSON({
    url: '...',
    defaultProjection: 'EPSG:4326',
    projection: 'EPSG:3857',

    attributions: [ new ol.Attribution({ 'html': "..." }) ]
});

If you wish to do further operations on your data once it is loaded in, you need to add a listener to a remotely loaded (e.g. GeoJSON file) source included within a Vector layer:

pointSource.once('change', function()
{
    if (pointSource.getState() == 'ready')
    { var features = pointSource.getFeatures(); ... }
};

Here’s a typical style function. I’m using a property “highlight” on my feature to style such features differently:

function pointStyle(feature, resolution)
{
    return [
        new ol.style.Style({
            image: new ol.style.Circle({
                radius: (feature.highlight ? 7 : feature.radius ),
                fill: new ol.style.Fill({ color: feature.fillColor }),
                stroke: new ol.style.Stroke({ width: feature.strokeWidth, color: '#fff' })
            }),
            text: new ol.style.Text({
                text: (feature.highlight ? feature.label : ""),
                font: '9px Ubuntu, Gill Sans, Helvetica, Arial, sans-serif',
                fill: new ol.style.Fill({ color: '#fff' })
            })
        })
    ]
};

Interactions

To detect clicks, I used an ol.interaction.Select – N.B. if you don’t specify which layers it applies to, it tries to apply them to all Vector layers!

var selectClick = new ol.interaction.Select({
    condition: ol.events.condition.click,
    style: function(feature, res) { return pointStyle(feature, res); },
    layers: [layerPoints]
});

selectClick.getFeatures().on('change:length', function(e)
{ ... }

olMap.addInteraction(selectClick);

In my function here I remove the flag from any already highlighted features and call features[i].changed(); to get the non-highlighed style. You don’t need to call this on what you’ve actually clicked on, as this is done implicitly. here’s likely better ways of showing selected/highlighted features, using ol.FeatureOverlay, but i couldn’t get this to work.

coordinates

MousePosition

There’s quite a nice new utility function which means it was little effort to get an “old style” location indicator in, at the bottom of the North/South interactive:
new ol.control.MousePosition({ projection: "EPSG:4326", coordinateFormat: ol.coordinate.toStringHDMS, className: 'olControlMousePosition' })

ttwf

DataShine: Travel to Work Flows

This loads vector data in as generic JSON through a regular (non-OL) AJAX call rather than GeoJSON so the processing is a bit more manual. This time, my source for the Vector layer is a simple ol.source.Vector which can be emptied with source.clear(); and reused.

I’m creating lines directly from the JSON, converting from OSGB grid and specifying colour (for the style) as I go – note my use of rgba format, allowing me to specify a partial transparency (of 60%) for the lines:

var startLL = ol.proj.transform([data[start][2], data[start][3]], "EPSG:27700", "EPSG:3857");
var endLL = ol.proj.transform([data[end][2], data[end][3]], "EPSG:27700", "EPSG:3857");
var journeyLine = new ol.geom.LineString([startLL, endLL]);
var lineItem = new ol.Feature({ geometry: journeyLine });
lineItem.strokeColor = 'rgba(255, 0, 0, 0.4)'; lineSource.addFeature(lineItem);

As previously blogged, I’m also using hand-crafted permalinks in both websites, and drag-and-drop KML display and UTF grid mouseovers in the latter, and both have also had their stylesheets tweaked to allow for easy printing – again made possible with OL3.

I’m about ready now to tackle my most complicated OpenLayers project by far, the Bike Share Map.

Categories
BODMAS OpenLayers Technical

OpenLayers 3 and DataShine

ds_ol3

OpenLayers is a powerful web mapping API that many of my websites use to display full-page “slippy” maps. DataShine: Census has been upgraded to use OpenLayers 3. Previously it was powered by OpenLayers 2, so it doesn’t sound like a major change, but OL3 is a major rewrite and as such it was quite an effort to migrate to it. I’ve run into issues with OL3 before, many of which have since been resolved by the library authors or myself. I was a bit grumbly in that earlier blogpost for which I apologise! Now that I have fought through, the clouds have lifted.

Here are some notes on the upgrade including details on a couple of major new features afforded by the update.

New Features

Drag-and-drop shapes

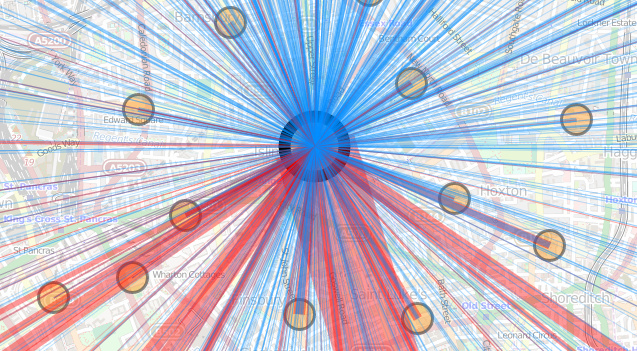
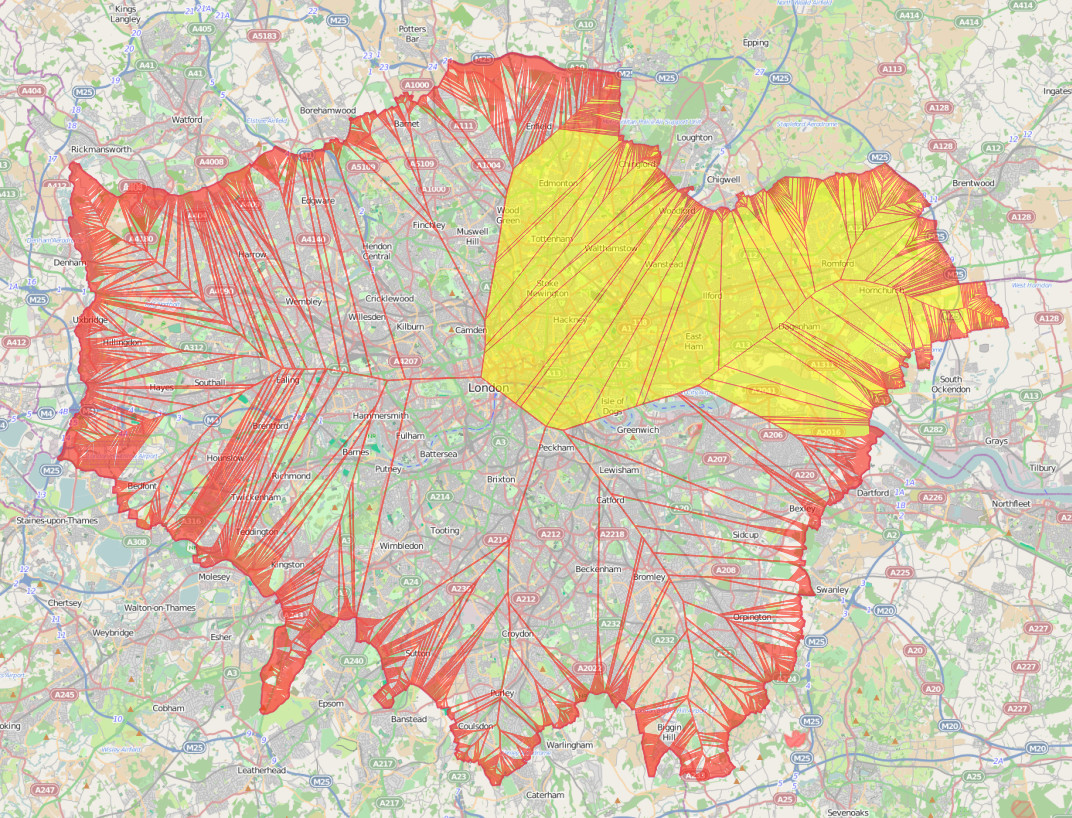
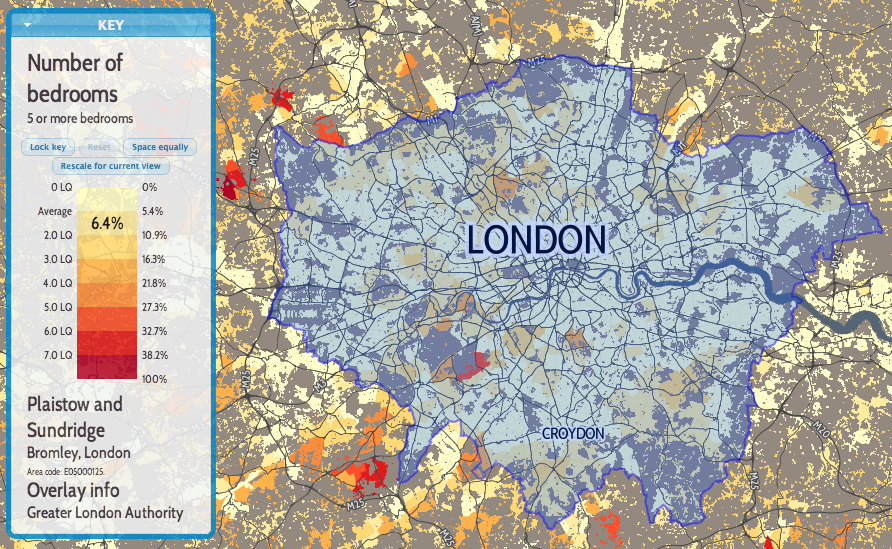
One of the nicest new features of OL3 is drag-and-dropping of KMLs, GeoJSONs and other geo-data files onto the map (simple example). This adds the features pans and zooms the map to the appropriate area. This is likely most useful for showing political/administrative boundaries, allowing for easier visual comparisons. For example, download and drag this file onto DataShine to see the GLA boundary appear. New buttons at the bottom allow for removal or opacity variation of the overlay files. If the added features include a “name” tag this appears on the key on the left, as you “mouse over” them. I modified the simple example to keep track of files added in this way, in an ol.layer.Group, initially empty when added to the map during initialisation.

Nice printing

Another key feature of OL3 that I was keen to make use of is much better looking printing of the map. With the updated library, this required only a few tweaks to CSS. Choosing the “background colours” option when printing is recommended. Printing also hides a couple of the panels you see on the website.

Nice zooming

OL3 also has much smoother zooming, and nicer looking controls. Try moving the slider on the bottom right up and down, to see the smooth zooming effect. The scale control also changes smoothly. Finally, data attributes and credits are now contained in an expandable control on the bottom left.

A bonus update, unrelated to OL3, is that I’ve recreated the placename labels with the same font as the DataShine UI, Cabin Condensed. The previous font I was using was a bit ugly.

Major reworkings to move from OL2 to OL3

UTF Grids

With OpenLayers 3.1, that was released in December 2014, a major missing feature was added back in – support for UTF Grid tiles of metadata. I use this to display the census information about the current area as you “mouse over” it. The new implementation wasn’t quite the same as the old though and I’ve had to do a few tricks to get it working. First of all, the ol.source.TileUTFGrid that your UTF ol.layer.Tile uses expects a TileJSON file. This was a new format that I hadn’t come across before. It also, as far as I can tell, insists on requesting the file with a JSONP callback. The TileJSON file then contains another URL to the UTF Grid file, which OL3 also calls requiring a JSONP callback. I implemented both of these with PHP files that return the appropriate data (with appropriate filetype and compression headers), programmatically building “files” based on various parameters I’m sending though. The display procedure is also a little different, with a new ol.source.TileUTFGrid.forDataAtCoordinateAndResolution function needing to be utilised.

In my map initialisation function:

layerUTFData = new ol.layer.Tile({});

var handleUTFData = function(coordinate)
{
  var viewResolution = olMap.getView().getResolution();
  layerUTFData.getSource().forDataAtCoordinateAndResolution(coordinate, viewResolution, showUTFData);
}

$(olMap.getViewport()).on('mousemove', function(evt) {
  var coordinate = olMap.getEventCoordinate(evt.originalEvent);
  handleUTFData(coordinate);
});

In my layer change function:

layerUTFData.setSource(new ol.source.TileUTFGrid({
  url: "http://datashine.org.uk/utf_tilejsonwrapper.php?json_name=" + jsonName
})

(where jsonName is how I’ve encoded the current census data being shown.)

Elsewhere:

var callback = function(data) { [show the data in the UI] }

In utf_tilejsonwrapper.php:

<?php
header('Content-Type: application/json');
$callback = $_GET['callback'];
$json_name = $_GET['json_name'];
echo $callback . "(";
echo "
{ 'grids' : ['http://datashine.org.uk/utf_tilefilewrapper.php?x={x}&y={y}&z={z}&json_name=$json_name'],
'tilejson' : '2.1.0', 'scheme' : 'xyz', 'tiles' : [''], 'version' : '1.0.0' }";
echo ')';
?>

(tilejson and tiles are the two mandatory parts of a TileJSON file.)

In utf_tilefilewrapper.php:

<?php
header('Content-Type: application/json');
$callback = $_GET['callback'];
$z = $_GET['z'];
$y = $_GET['y'];
$x = $_GET['x'];
$json_name = $_GET['json_name'];
echo $callback . "(";
echo file_get_contents("http://[URL to my UTF files or creator service]/$json_name/$z/$x/$y.json");
echo ')';
?>

Permalinks

The other change that required careful coding to recreate the functionality of OL2, was permalinks. The OL3 developers have stated that they consider permalinks to be the responsibility of the the application (e.g. DataShine) rather than the mapping API, and, to a large extent, I agree. However OL2 created permalinks in a particular way and it would be useful to include OL3 ones in the same format, so that external custom links to DataShine continue to work correctly. To do this, I had to mimic the old “layers”, “zoom”, “lat” and “lon” parameters that OL2’s permalink updated, and again work in my custom “table”, “col” and “ramp” ones.

Various listeners for events need to be added, and functions appended, for when the URL needs to be updated. Note that the “zoom ended” event has changed its name/location – unlike moveend (end of a pan) which sits on your ol.map, the old “zoomend” is now called change:resolution and sets on olMap.getView(). Incidentally, the appropriate mouseover event is in an OL3-created HTML element now – olMap.getViewport() – and is mousemove.

Using the permalink parameters (args):

if (args['layers']) {
  var layers = args['layers'];
  if (layers.substring(1, 2) == "F") {
    layerBuildMask.setVisible(false);
  }
  [etc...]
}
[& similarly for the other args]

On map initialisation:

args = []; //Created this global variable elsewhere.
var hash = window.location.hash;
if (hash.length > 0) {
  var elements = hash.split('&');
  elements[0] = elements[0].substring(1); /* Remove the # */
  for(var i = 0; i < elements.length; i++) {     var pair = elements[i].split('=');     args[pair[0]] = pair[1];   } }

Whenever something happens that means the URL needs an update, call a function that includes this:

var layerString = "B"; //My old "base layer"
layerBuildMask.getVisible() ? layerString += "T" : layerString += "F";
[etc...]
layerString += "T"; //The UTF data layer.
[...]
var centre = ol.proj.transform(olMap.getView().getCenter(), "EPSG:3857", "EPSG:4326");
window.location.hash = "table=" + tableval + "&col=" + colval + "&ramp=" + colourRamp + "&layers=" + layerString + "&zoom=" + olMap.getView().getZoom() + "&lon=" + centre[0].toFixed(4) + "&lat=" + centre[1].toFixed(4);
}

Issues Remaining

There remains a big performance drop-off in panning when using DataShine on mobile phones and other small-screen devices. I have put in a workaround "viewport" meta-tag in the HTML which halves the UI size, and this makes panning work on an iPhone 4/4S, viewed horizontally, but as soon as the display is a bit bigger (e.g. iPhone 5 viewed horizontally) performance drops off a cliff. It's not a gradual thing, but a sudden decrease in update-speed as you pan around, from a few per second, to one every few seconds.

Additional Notes

Openlayers 3 is compatible with Proj4js version 2 only. Using this newer version requires a slightly different syntax when adding special projections. I use Proj4js to handle the Ordnance Survey GB projection (aka ESPG:27700), which is used for the postcode search, as I use a file derived from the Ordnance Survey's Code-Point Open product.

I had no problems with my existing JQuery/JQueryUI-based code, which powers much of the non-map part of the website, when doing the upgrade.

Remember to link in the new ol.css stylesheet, or controls will not display correctly. This was not needed for OL2.

OL3 is getting there. The biggest issue remains the sparsity of documentation available online - so I hope the above notes are helpful in the interim.

ds_ol3overlay2

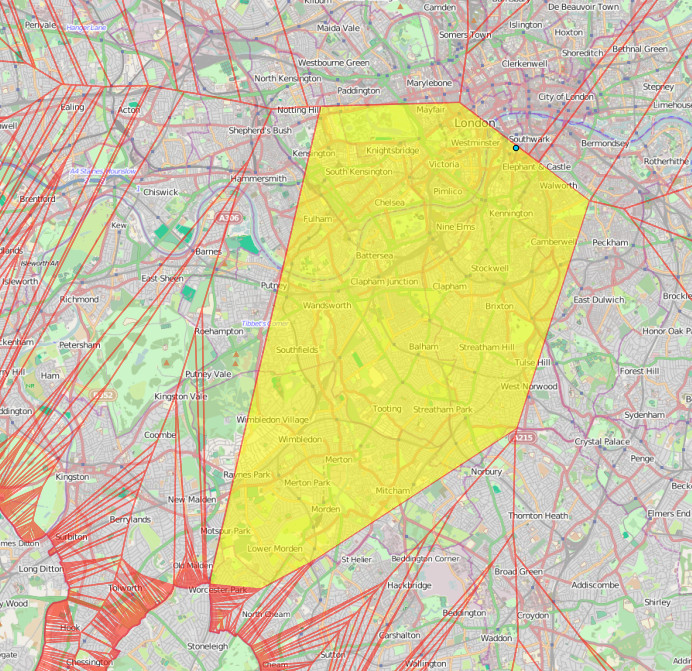
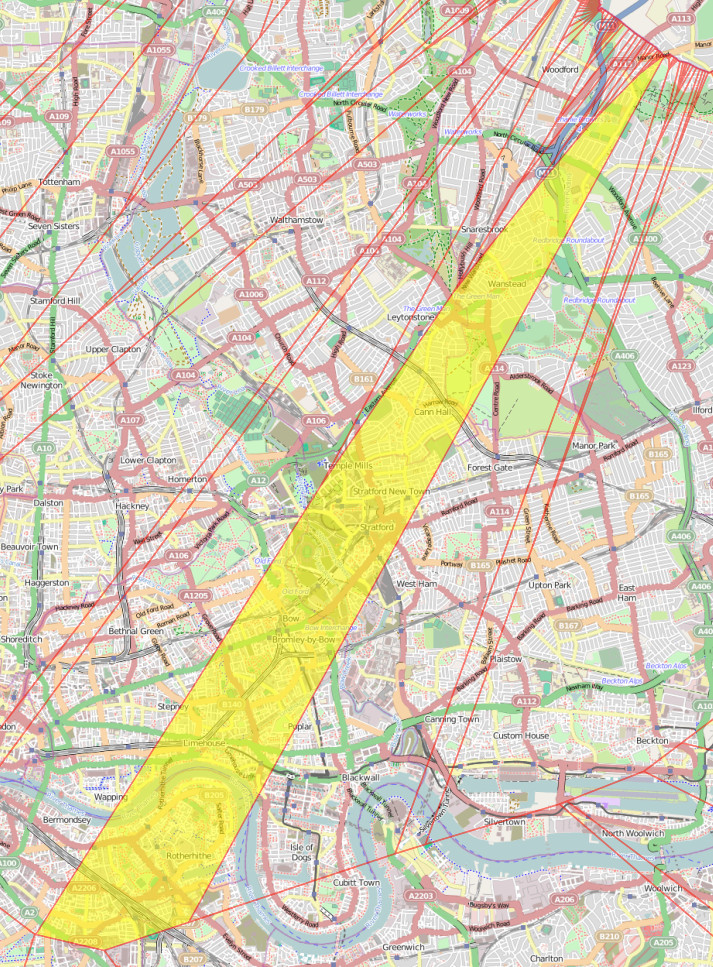
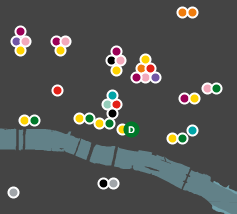
Above: GeoJSON-format datafiles for tube lines and stations (both in blue), added onto a DataShine map of commuters (% by tube) in south London.
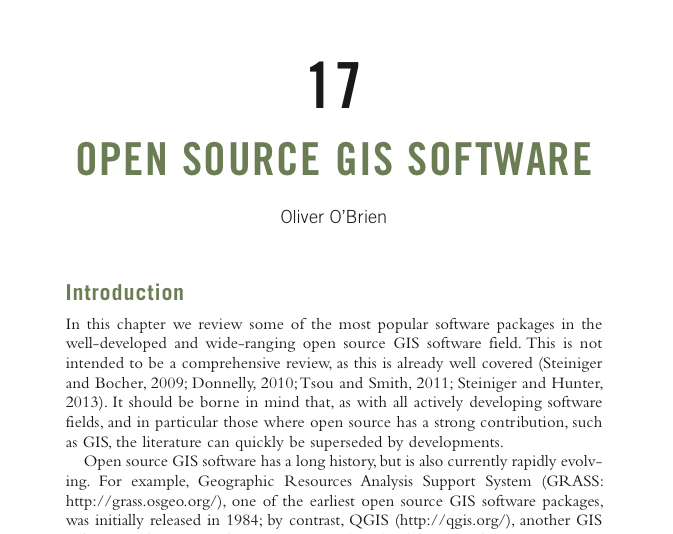
Categories
OpenLayers Technical

OpenLayers 3

ol-logo

As a learning exercise, I been trying to “migrate” my recent #indyref map from OpenLayers 2.13.1 to the very new version 3.0.0 of the popular mapping API. It seemed a good time to learn this, because the OpenLayers website now shows v3 as the default version for people to download and use. Much of my output in the last few years has been maps based on OpenLayers, so I have considerable interest in the new version. There are some production sites using OpenLayers 3 already – for example, the official Swiss map.

I use the term “migrate” in inverted commas, because, really, OpenLayers 3 is pretty much a rewrite, with an altered object model, and accordingly requires coding from scratch a new map rather than just changing a few lines. It has so far taken me four times as long to do the conversion, as it did to create the original map, although that is an inevitable consequence of learning as I go along.

I’ll update this blogpost as I discover workarounds.

Shortcomings in v3 that I have come across so far:

  • No Permalink control. This is unfortunate, particularly as “anchor” style permalinks, which update as you move around the map, are very useful for visualisations like DataShine where people share specific views and places, and I can inject extra parameters in. The site linked above suggests this is a feature that should not be in the core mapping library, but instead an additional library can query/construct necessary parameters. Perhaps, but I think layer/zoom/lat/lon parameters are such a key part of a map (as opposed to other interactive content) that they still deserve to be treated specially.
  • The online documentation, particularly the apidoc, is very sparse in places. As mentioned above, there is also some mismatching in functionality suggested in the online tutorials, to what is actually available. Another example, the use of “font” instead of “fontSize” and “fontStyle” for styles. This will improve I am sure, and there is at least one book available on OpenLayers 3, but it’s still a little frustrating at this stage.
  • Label centering on the circle vectors is not as good as with OL 2. This is possibly due to antialiasing of the circle itself. You can see the labels “jump” slightly when comparing the two versions – see links below.
  • Much, much slower on my iPhone 4 (and also on a friend’s Android phone). This is not what I was expecting! This is the “killer” problem for me which means I’ve kept my map on OL 2 for now. Wrapping my vector layer in an Image layer is supposed to speed things up, but causes the layer not to display on my iPhone. Disabling the potentially expensive mousemove listener did not make a difference. Adding a viewport meta tag with width=device-width speeded things up a lot so that it was almost as fast as OL 2 (without the meta tag) but then I would need to rewrite my own UI for mobile – something I don’t need to do with the OL 2 version!
  • No support (yet) for UTFGrids. These are a form of vector tiles, for metadata rather than geographic features, which I use on the DataShine project.

Things which I like about the new version:

  • Smooth vector resizing/repositioning when zooming in/out on a computer. (N.B. This is only when using a Vector layer and a Vector source, rather than Image layer with an ImageVector source that itself uses a Vector source.)
  • Attribution is handled better, it looks nicer.
  • No need to have a 100% width/height on the map div any more.
  • Resolution-specific styling. I’ve used this to hide the labels when zoomed out beyond a certain amount.
  • Can finally specify (in a straightforward fashion) a minimum zoom level.
  • Point coordinates and extents/bounds are specified in a much simpler way.
  • On a more general note, the new syntax is more complete and feels less “hacky”. The developers have taken the opportunity to do it “right” and remove inconsistencies, misplaced functionality and other quirks from the old version. For example, separating out visual UI controls and interaction management controls into two separate classes.
  • Drag-and-drop addition of KML/GeoJSON vector features. Example (use this file as a test).

Some gotchas, which got me for a bit, but I was able to solve:

  • You need to link in a new ol.css stylesheet, not just the Javascript library, in order to get the default controls to display and position correctly.
  • Attribution information is attached to a source object now, not directly to the layer. A layer contains a source.
  • Attribute-based vector styling is a lot more complicated to specify. You need to create a function which you feed in to an attribute. The function has to return a style wrapped in an array – this may be the closure syntax in Javascript that I have not come across before.
  • Hover/mouseover events are not handled directly by OpenLayers any more – but click events are, so the two event types require quite different setups.
  • Minor differences between the debug and regular versions of the library. The example I noticed is that the debug version allows ol.control.ScaleLineUnits.METRIC to be specified as an attribute for the ScaleLine control, but the non-debug version needs to use an explicit string “metric”.
  • No opacity control on individual styles – only on layers. This means I can’t have the circles with the fill at 80% opacity but the text at 100% opacity. Opacity can be set on styles, but has to be specified as part of the colour, in RGBA format (where A is the alpha, i.e. opacity, you want) rather than as a separate attribute. This is contrary to the tutorials on the website. Layer opacity can continue to be specified as seperate attributes.

My OpenLayers 3 version of the #indyref map is here – compare with the OpenLayers 2 one. Note that, since first writing this blogpost, I’ve subsequently updated the OpenLayers 2 one to change the cartography there further.

Categories
London Technical

Borough Tops

Screen Shot 2014-08-05 at 14.49.16

The Diamond Geezer is, this month, climbing the highest tops in each one of London’s 33 boroughs.

To find the highest points, he’s used a number of websites which list the places. These derive the data from contour lines, perhaps supplemented with GPS or other measurements. However, another interesting – and new – datasource for calculating this kind of metric, is OS Terrain 50. Released as part of the Ordnance Survey Open Data packages, it is a gridded DEM (Digital Elevation Model). It’s right up to date, at 50m x 50m horizontal resolution, and 10cm vertical resolution, and it should correct for buildings, so showing the true ground height.

Looking at the DEM for Newham, I think it reveals a new highest point – not Wanstead Flats at 15m above sea level, as Diamond Geezer’s lists suggest, but Westfield Avenue, the new road that runs through the Olympic Park. Beside John Lewis, the road rises, to a highest point of 21.6m. It shows as purple in the graphic above. Nearby, the new “bowl” of the lower part of the Olympic Stadium can be seen, as well as the trench through which High Speed 1 runs, at Stratford International Station.

I can’t argue with the Chancery Lane/Holborn junction as being the highest ground-point in the City of London, at 21.9m. In Tower Hamlets, it’s more tricky. The old railyards between Shoreditch High Street and the lines into Liverpool Street look like they are at 21.7m, however the ground here is not publically accessible, and the DEM is quite noisy here, with only part of the railyard showing this height.

I’m looking for a way to do this programatically – calculating the highest DEM value for each borough. I’ve tried using QGIS’s Zonal Statistics plugin, with polygon shapefiles of London’s boroughs, but this only shows the mean value of the DEM for that borough.

Here’s the list I’ve created by measuring – the main issue with my dataset is that the measurements are only at the centre of each 50m x 50m cell.

Borough Hgt (m) 50m cn 10-digit grid ref Description of
approximate location
By edge?
Barking and Dagenham 45.3 TQ_48590_89948 Industrial area just E of northern part of Whalebone Lane North.
Barnet 146.1 TQ 21955 95622 Just south of the water tower to the east of Rowley Lane, near Rowley Green.
Bexley 81 TQ 45737 71256 Langdon Shaw, southwest side. Yes
Brent 91.2 TQ 20732 88877 Junction of Wakemans Hill Avenue and The Grove.
Bromley 246.5 TQ 43637 56487 A233 – where Main Road changes name to Westerham Hill Yes
Camden 135.6 TQ 26277 86225 Lower Terrace, just off Heath Street in Hampstead. Yes
City of London 21.9 TQ 30970 81612 NW edge – junction of Holborn and Chancery Lane.
Croydon 175.7 TQ 34330 61827 Sanderstead Plantation, SW path crossroads.
Ealing 81.5 TQ 16177 84398 Horsenden Hill
Enfield 118.7 TQ 25632 97674 Just north of Camlet Way, Hadley Wood, opposite Calderwood Place. Yes
Greenwich 131.1 TQ 43831 76583 Southern end of Eaglesfield Recreation Ground on Shooters Hill.
Hackney 39.8 TQ 32025 87574 In Finsbury Park, beside Green Lanes, opposite No. 330. Yes
Hammersmith and Fulham 45.9 TQ 22960 82756 Harrow Road at north end of bridge over the railway line near Kensal Green station. Yes
Haringey 129 TQ 28326 87479 Ground by Highgate School Chapel, just north of Highgate High Street.
Harrow 153.4 TQ 15288 93808 Magpie Hall Road, between The Common and Alpine Walk. Yes
Havering 106 TQ 51192 93055 Churchyard of St John the Evangelist church (also Broxhill Road by the cricket pitch)
Hillingdon 130.5 TQ 10585 91678 Junction of South View Road and Potter Street Hill Yes
Hounslow 33.6 TQ 11320 78815 Western Road – bridge over the Grand Union Canal.
Islington 99.9 TQ 28874 87217 Highgate Hill and Hornsey Lane junction. Yes
Kensington and Chelsea 45.7 TQ 23014 82728 Kensal Green Cemetery, northern edge, beside the Harrow Road, above the railway line. Yes
Kingston upon Thames 91.3 TQ 16644 60376 Telegraph Hill
Lambeth 110.9 TQ 33620 70729 Westow HIll and Japser Road junction. Yes
Lewisham 111.2 TQ 33918 71779 Sydenham Hill and Rock Hill junction. Yes
Merton 56 TQ 23627 70823 Lauriston Road and Wilberforce Way NW junction.
Newham 21.6 TQ 37967 84530 Westfield Avenue, outside John Lewis in Westfield Stratford City.
Redbridge 91.5 TQ 47945 93784 Cabin Hill
Richmond upon Thames 56 TQ 18779 73065 Bridleway/path junction just east of Queens Road, opposite the Pembroke Lodge car-park and to the NE of it.
Southwark 111.5 TQ 33926 71686 Sydenham Hill, between Chestnut Place and Bluebell Close. Yes
Sutton 146.4 TQ 28383 59986 Middle of rectangle of land south-east of Corrigan Avenue and south-west of Richland Avenue.
Tower Hamlets 21.7 TQ 33720 82184 Railway yards between Shoreditch High Street station and the railways lines leading to Liverpool St Station.
Waltham Forest 92.2 TQ 38415 95010 Pole Hill (north top)
Wandsworth 60.7 TQ 22881 72780 Big Alp, Wimbledon Common
Westminster 53 TQ 26627 18386 Finchley Road and Boundary Road junction. Yes
Categories
London Technical

Centre of London – the Debate Rumbles On

londoncentre

There’s a lot of ways you can define the centre of London.

The Londonist had a good go last month, and CASA geographer Adam Dennett has a shot too, following an article in today’s Evening Standard newspaper.

  • The former site of the Charing Cross, marked by a plaque in front of the Charles I statue at the small roundabout in Trafalgar Square. It is where distances to “London” are measured to on the UK road network.
  • Trafalgar Square itself as the “focal point” of London events.
  • Centre Point by Tottenham Court Road station (because of the building’s name).
  • Bank junction (because a lot of roads converge at a single point there, and it is the heart of the historic City of London).
  • Farringdon station because that is where Thameslink and Crossrail, London’s two major cross-capital railway lines, will meet.
  • Oxford Circus as this is the busiest tube station on the network.
  • The Londonist definition of Frazier Street near Waterloo, based on the centroid of the Greater London administrative boundary.
  • The Evening Standard definition of a bench on the Victoria Embankment, based on the centroid of the inner London ring road.
  • Adam’s definition which is between Jubilee Gardens and Waterloo, based on the centroid of a weighted population distribution (so the dense inner city populations affect the location more than the sparse surburbs). Jubilee Gardens is just by the London Eye.
  • There are, I’m sure, many others.

I offer an alternative definition – the place which is within London but furthest from the Greater London boundary as the crow flies. A few negative Buffer operations in QGIS reveal that this place, 16.77 km or 10.42 miles from three places on the Greater London border (to the north-east, north and south-west), is Tyler’s Court in Soho , just off Wardour Street – see map above. There is nowhere else in London that is further away from its borders. I don’t think my definition is as geographically appropriate as some of the others above (as it is subject to the whims of the meandering London border more than its area or its population), but certainly if you are ever wandering around Soho on a Saturday evening, it feels a long way from the Great British Countryside.

Image background mapping © OpenStreetMap contributors.

Categories
London Technical

37000 Old OS Maps

nls_kew

The National Library of Scotland (NLS) yesterday unveiled a HUGE collection of maps that they have digitised and placed online. The maps, covering England and Wales, are historic Ordnance Survey maps that are between 60 and 170 years old and are at a high resolution. The scale is 6-inch-to-the-mile and covers the whole country. At the moment each map can be viewed by clicking on the appropriate box on an online map, they plan to undertake further work to join many of the maps together to create a single scrollable historic map of the whole country this summer.

The extract above, of the Kew Bridge area in 1899, is from this map (I’ve shifted the white balance.) Some of the maps have some rather nice colouring for water – with the blue colour being augmented by some subtle shading on the riverbanks. The same effect is see in a Snowdon map (extract below), from 1889.

I featured an earlier release of Victorian 60-inch-to-the-mile maps, for London, on Mapping London. The number of retweets and Facebook likes for this posting was unprecedented for the blog, suggesting a huge interest in high quality scans of historic maps.

Here’s their press release, includes the reason why the NLS is including maps from outside Scotland!

New map resource – OS six-inch England and Wales, 1842-1952

We are very pleased to announce the availability of a new website resource – zoomable colour images of the Ordnance Survey’s six-inch to the mile (1:10,560) mapping of England and Wales. All our map digitisation work in recent years has been externally funded, hence the recent expansion of our map images beyond Scotland.

This is the most detailed OS topographic mapping covering all of England and Wales from the 1840s to the 1950s. It was revised for the whole country twice between 1842-1893 and between 1891-1914, and then updated regularly for urban or rapidly changing areas from 1914 to the 1940s. Our holdings are made up of 37,390 sheets, including 35,124 quarter sheets, and 2,237 full sheets.

The maps are immensely valuable for local and family history, allowing most features in the landscape to be shown. The more detailed 25 inch to the mile (or 1:2,500) maps allow specific features to be seen more clearly in urban areas, as well as greater detail for buildings and railways. However, most topographic features on the 25 inch to the mile maps are in fact also shown on the six-inch to the mile maps.

The easiest way of finding sheets is through a clickable graphic index using our ‘Find by Place’ viewer: http://maps.nls.uk/openlayers.cfm?id=39&zoom=6&lat=53.39954&lon=-3.0305

This allows searching through a gazetteer of placenames, street names, postcodes and Grid References, as well as by zooming in on an area of interest with smaller-scale locational mapping as a backdrop.

The sheets are also available via county lists: http://maps.nls.uk/os/6inch-england-and-wales/counties.html

We plan to also make georeferenced mosaics available of the series by the late summer.

OS six-inch England and Wales home page: http://maps.nls.uk/os/6inch-england-and-wales/index.html

Further information: http://maps.nls.uk/os/6inch-england-and-wales/info1.html

nls_snowdon
Categories
London Technical

I’m a Londoner… Get Me Out of Here!

leavelondon_essex

Diamond Geezer escaped from London by plotting the shortest distance (as the crow flies) from his home to the London boundary, and then taking the shortest walking route that gets to that same point on the boundary. He identified a pub in Woodford Green as the closest point on the boundary from a nominal start location at the Bow Roundabout in east London. A great example of experimental travel.

Being an occasional spatial analyst I wondered if there was a way to do the first step – identifying the closest point to me that is outside of London – using a GIS. In so doing I identified that there are five key exit points to where a large portion of Londoners could “escape” to. Additionally, it’s a novel way of identifying the location of a north/south London line, an east/west London split, and a way of working out which home county is your closest. Most of these are obvious if you are in outer London (Zones 3+), but are not so apparent if you are an inner-city dweller. The map above shows the parts of London where The Only Way Is Essex if you are looking for the shortest route out as the crow flies. This includes, somewhat surprisingly, the northern corner of Burgess Park, on the Old Kent Road in what most people would consider south London.

It turns out it is relatively straightforward to produce such a map – however with the important simplification that it is necessary to treat the boundary as a series of points, rather than as a border “line”, to avoid the problem with huge numbers of very small areas when increasingly close to the line. I used QGIS to create the resulting map, shown above. To create the map, follow the steps at the bottom of this post.

The bit of London’s border which has the largest part of London as its go-to point, shown on the map below, is just behind The Midas Touch pub, just south of Worcester Park station. This is the closest point on the London border for a huge area, including such places as diverse as Hyde Park, Kensington and Elephant & Castle.

leavelondon_biggest

The blue dot near Waterloo in the map above, by the way, is the geographical centre, or “centroid“, of London.

So did DG head to the right place? Nearly. The exit point is on Manor Road, by Woodfood Green, just a short walk from the aforementioned Woodford Green pub:

leavelondon_dg

& those five exit points most useful to Londoners? The places on the edge of London that are the nearest such place for the the five largest single polygons on the map. They are:

  • Just behind the aforementioned Midas Touch pub near Worcester Park station.
  • The junction of footpaths just beyond the end of Courtwood Lane, in Forestdale. Near Tramlink’s Gravel Hill station.
  • A track just inside the northern edge of Joydens Wood (the wood itself, not the village). Not far from Bexley.
  • The far end of the first road loop in Elstree Park, just off the Stirling Corner roundabout.
  • The middle of the woodland behind Monken Hadley Church of England Primary School.

So now you know.

Addendum: How to create the map yourself

You’ll need QGIS installed and to be familiar with how to use it to load layers, change settings etc.

Note: In many of these steps, the GIS operation requires the naming of a new Shapefile that is created, which should then be added to the list of loaded layers (aka Table of Contents) for the next operation.

  1. Add http://mapit.mysociety.org/area/2247.geojson as a new layer. This loads in the London (strictly, Greater London Authority plus City of London) boundary.
  2. Save this layer as a Shapefile, with CRS set to British National Grid, aka ESPG:27700, and add it back in to the project. The specification of British National Grid is necessary to ensure that “proper” square metres are used in the distance calculations.
  3. Set the project to allow on-the-fly reprojection, and set its coordinate reference system to British National Grid, also.
  4. Choose “Extract nodes” from the Geometry Tools submenu in the Vector menu. Because the London boundary is sufficiently complex, there is generally at least one point at least every 100m along the boundary. Optional: You can simplify the boundary before this step, for example if simplifying to 20m accuracy, this will drop the number of points generated from around 10000 to around 1000, although the resulting final map will look a little different.
  5. Choose “Voroni polygons” from the Geometry Tools submenu in the Vector menu.
  6. Choose “Clip” from the Geoprocessing Tools submenu in the Vector menu. You need to clip your newly created Voroni polygons layer to the original boundary polygon that was loaded in in the first step. This step will take a few minutes if you didn’t simplify the boundary.
  7. Add in an OpenStreetMap background. This can be done by installing the OpenLayers plugin, then using the plugin’s menu and adding an OpenStreetMap layer. You normally need to pan (or zoom) the map a bit for it to first load in. Note also this step will reproject the map to “WebMercator” which is similar to, but not the same as, British National Grid – sufficient for display purposes however.
  8. Reorder the layer list so that the OpenStreetMap layer is at the bottom.
  9. Remove all the other layers except for your newly clipped Voroni polygons and the OpenStreetMap background.
  10. Adjust the styling of the Voroni layer, so that the polygons are semi-transparent.
Categories
Technical

This Blog has Moved!

The blog is now at https://oobrien.com/. The old oliverobrien.co.uk domain will continue to work for a couple of weeks. My leisure blog has also moved and is now at /.

Why? I’m consolidating the number of domains I own, to make management easier.